Video Abstract
Abstract
Pitch conveys critical information in speech, music and other natural sounds, and is conventionally defined as the perceptual correlate of a sound's fundamental frequency (F0). Although pitch is widely assumed to be subserved by a single F0 estimation process, real-world pitch tasks vary enormously, raising the possibility of underlying mechanistic diversity. To probe pitch mechanisms, we conducted a battery of pitch-related music and speech tasks using conventional harmonic sounds and inharmonic sounds whose frequencies lack a common F0. Some pitch-related abilities - those relying on musical interval or voice recognition were strongly impaired by inharmonicity, suggesting a reliance on F0. However, other tasks, including those dependent on pitch contours in speech and music, were unaffected by inharmonicity, suggesting a mechanism that tracks the frequency spectrum rather than the F0. The results suggest that pitch perception is mediated by several different mechanisms, only some of which conform to traditional notions of pitch.
Stimuli Examples
Experiment 1: Two-Tone Basic Discrimination
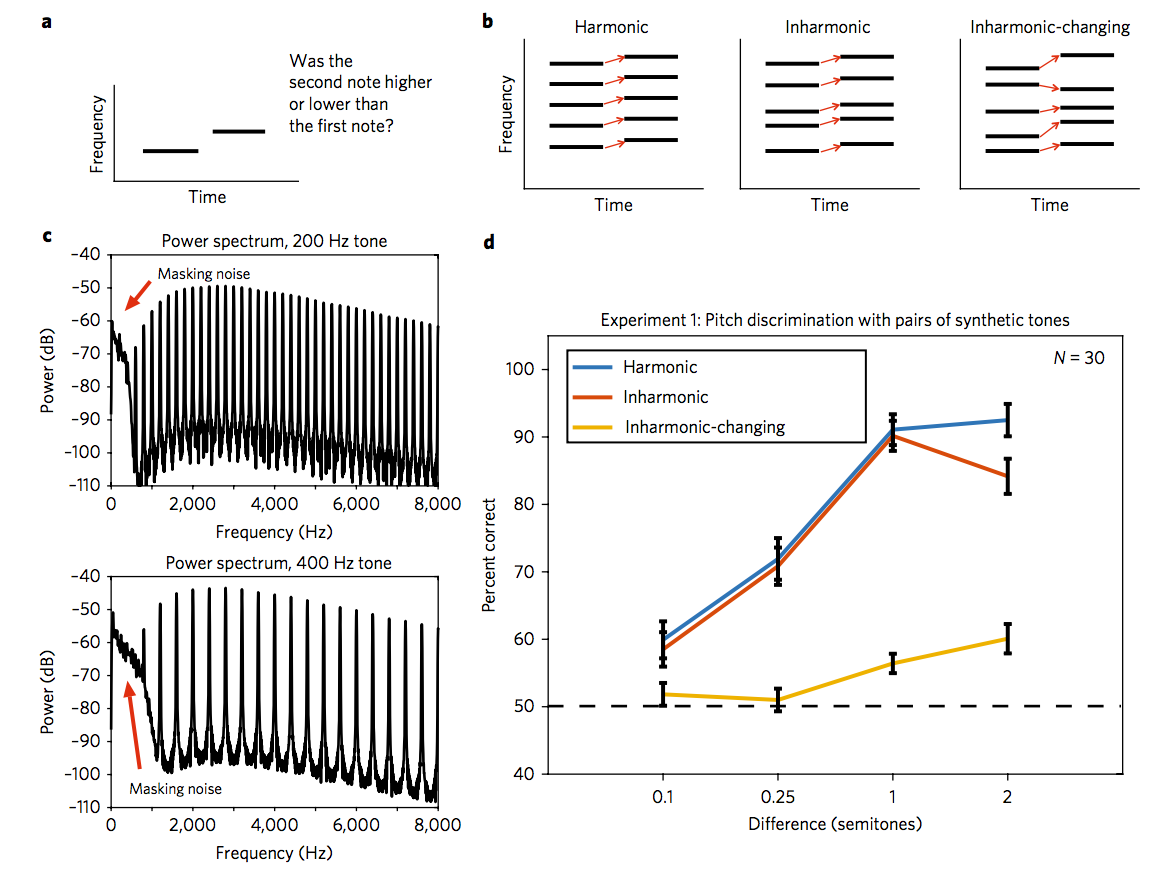
Figure 2. Task, example stimuli, and results for Experiments 1 and 2: pitch discrimination with pairs of synthetic tones and instrument notes
A) Schematic of the trial structure for Experiment 1. During each trial, participants heard two notes and judged whether the second note was higher or lower than the first note.
B) Schematic of the three conditions for Experiment 1. Harmonic trials consisted of two harmonic notes. Inharmonic trials contained two inharmonic notes, where each note was made inharmonic by the same jitter pattern, such that the frequency ratios between components were preserved. This maintains a correspondence in the spectral pattern between the two notes, as for harmonic notes (indicated by red arrows). For Inharmonic-Changing trials, a different jitter pattern was applied to the harmonics of each tone, eliminating the correspondence in the spectral pattern.
C) Autocorrelation of harmonic and inharmonic waveforms from Figure 1 (250 Hz tones). The harmonic tone yields an autocorrelation of 1 at a time lag corresponding to its period (1/F0). The inharmonic tone has no such peak, indicative of its aperiodicity.
D) Power spectra of two examples tones from Experiment 1 (with F0s of 200 and 400 Hz, to convey the range of F0s used in the experiment). The fixed bandpass filter applied to each note is evident in the envelope of the spectrum, as is the low-pass noise added to mask distortion products. The filter was intended to eliminate the spectral centroid or edge as a cue for pitch changes.
E) Results from Experiment 1. Error bars denote standard error of the mean.
Harmonic, 1 Semitone Shift (2nd Tone Higher)
Inharmonic, 1 Semitone Shift (2nd Note Higher)
Inharmonic - Changing, 1 Semitone Shift (2nd Tone Higher)
Experiment 2: Two-Tone Basic Discrimination With Instrument Notes
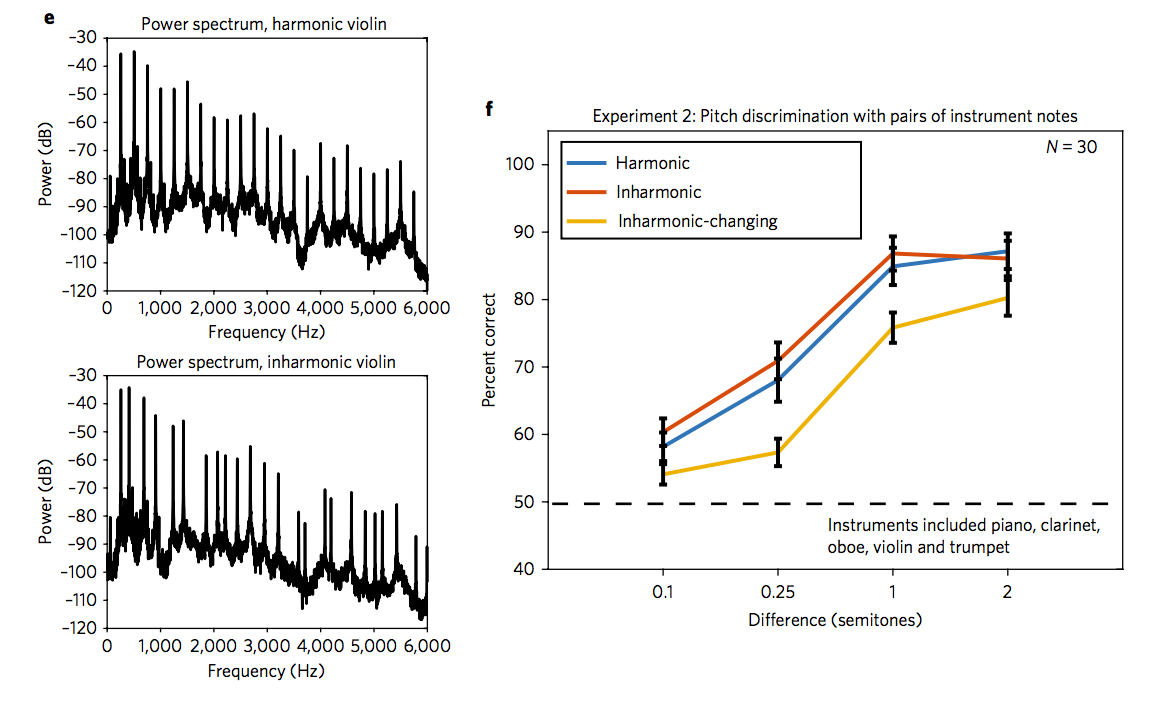
Figure 2. Task, example stimuli, and results for Experiment 1: pitch discrimination with pairs of notes
(F) Example power spectra of harmonic and inharmonic violin notes from Experiment 2.
(G) Results from Experiment 2. Error bars denote standard error of the mean.
Harmonic, 1 Semitone Shift (2nd Tone Higher)
Inharmonic, 1 Semitone Shift (2nd Note Higher)
Inharmonic - Changing, 1 Semitone Shift (2nd Tone Higher)
Experiment 3: Melodic Contour Discrimination
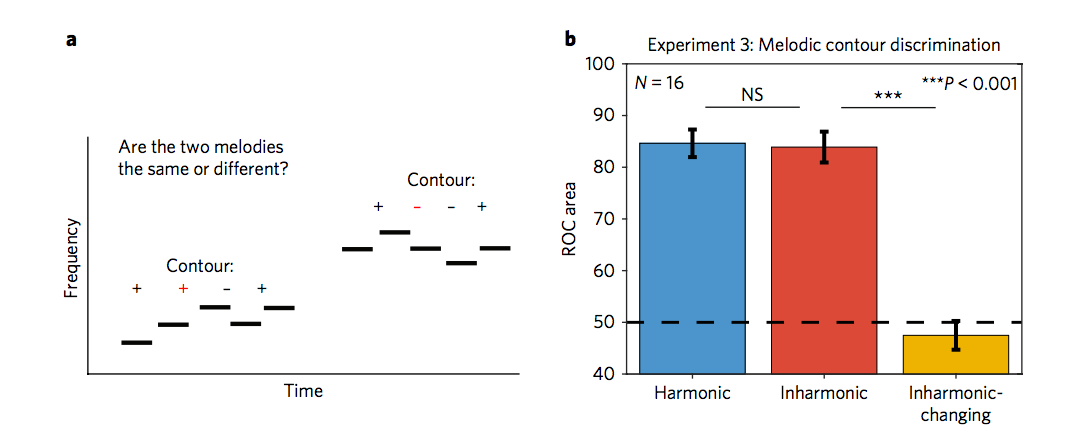
Figure 3. Task and results for Experiment 3: melodic contour discrimination
(A) Schematic of the trial structure for Experiment 3. Participants heard two melodies with note-to-note steps of +1 or -1 semitones, and judged whether the two melodies were the same or different. The second melody was always transposed up in pitch relative to the first melody.
(B) Results from Experiment 3. Performance was measured as the area under Receiver Operating Characteristic (ROC) curves. Error bars denote standard error of the mean.
Harmonic
Inharmonic
Inharmonic - Changing
Experiment 4: Speech Contour Perception
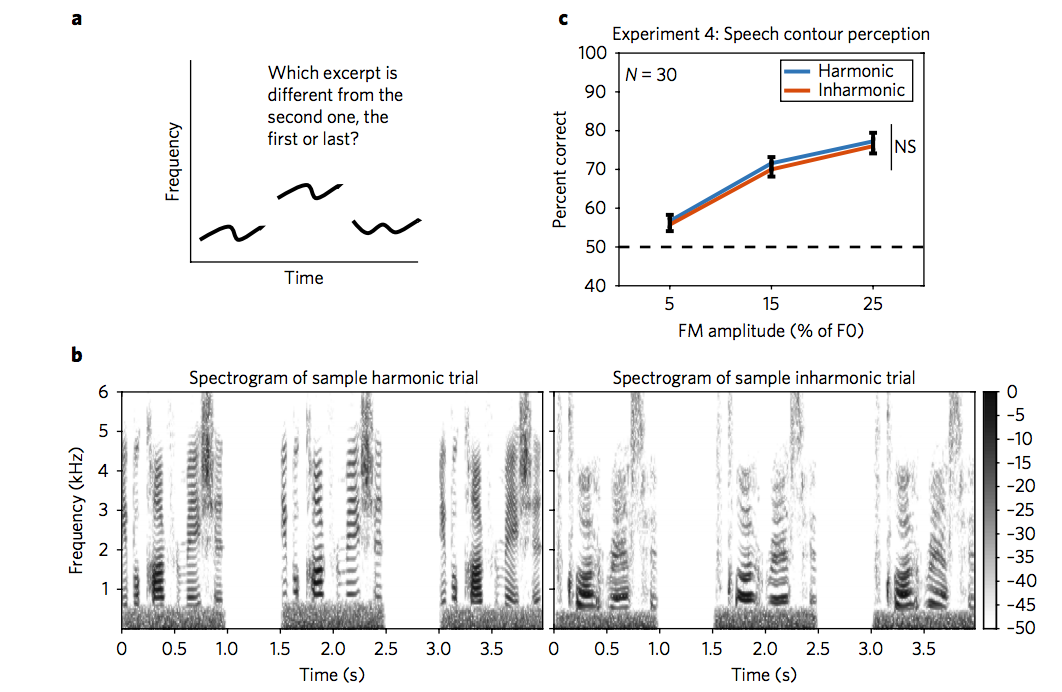
Figure 4. Tasks and results for Experiments 4 and 5: speech contour perception and Mandarin tone perception
(A) Schematic of the trial structure for Experiment 4. Participants heard three one-second resynthesized speech utterances, the first or last of which had a random frequency modulation (1-2 Hz bandpass noise, whose modulation depth varied across conditions) added to the F0 contour. Participants were asked whether the first or last speech excerpt differed from second speech excerpt. The second except was always shifted up in pitch to force listeners to make judgments about the prosodic contour rather than the absolute pitch of the stimuli.
(B) Example spectrograms of stimuli from harmonic and inharmonic trials from Experiment 4. Note the even and jittered spacing of frequency components in the two trial types. In these examples, the final excerpt in the trial contains the added frequency modulation.
(C) Results from Experiment 4. Error bars denote standard error of the mean.
Harmonic
Inharmonic
Experiment 4: Mandarin Tone Perception
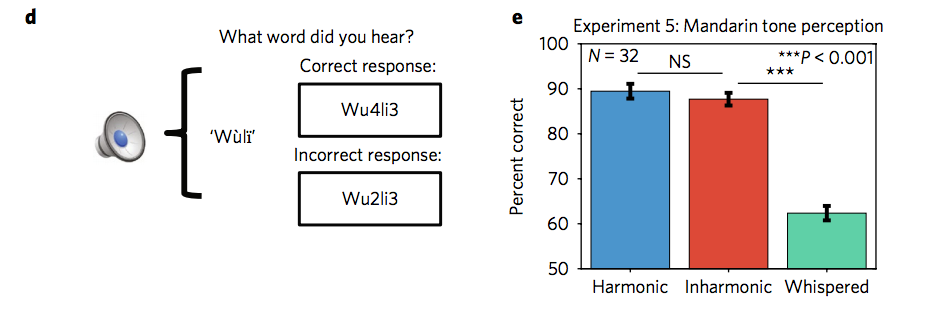
(D) Schematic of trial structure for Experiment 5. Participants (fluent Mandarin speakers) heard a single resynthesized Mandarin word and were asked to type what they heard (in Pinyin).
(E) Results for Experiment 5. Error bars denote standard error of the mean.
Harmonic
Inharmonic
Whisper
Experiment 6: Familiar Melody Recognition
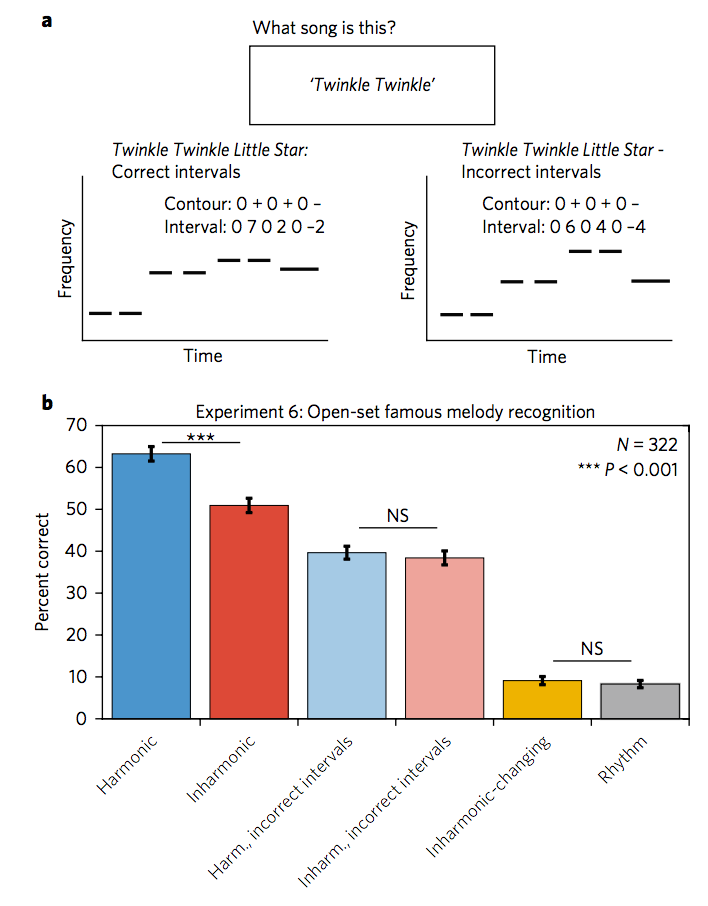
Figure 6. Task, results, schematic of incorrect interval trials from Experiment 6: familiar melody recognition
(A) Stimuli and task for Experiment 6. Participants on Amazon Mechanical Turk heard 24 melodies, modified in various ways, and were asked to identify each melody by typing identifying information into a computer interface. Three conditions (Harmonic, Inharmonic, and Inharmonic-Changing) preserved the pitch intervals between notes. Two additional conditions (Incorrect Intervals with harmonic or inharmonic notes) altered each interval between notes but preserved the contour (direction of pitch change between notes). The Rhythm condition preserved the rhythm of the melody, but used a flat pitch contour.
(B) Results from Experiment 5. Error bars denote standard deviations calculated via bootstrap.
Harmonic
Inharmonic
Inharmonic - Changing
Harmonic - Incorrect Intervals
Inharmonic - Incorrect Intervals
Experiment 7: Sour Note Detection
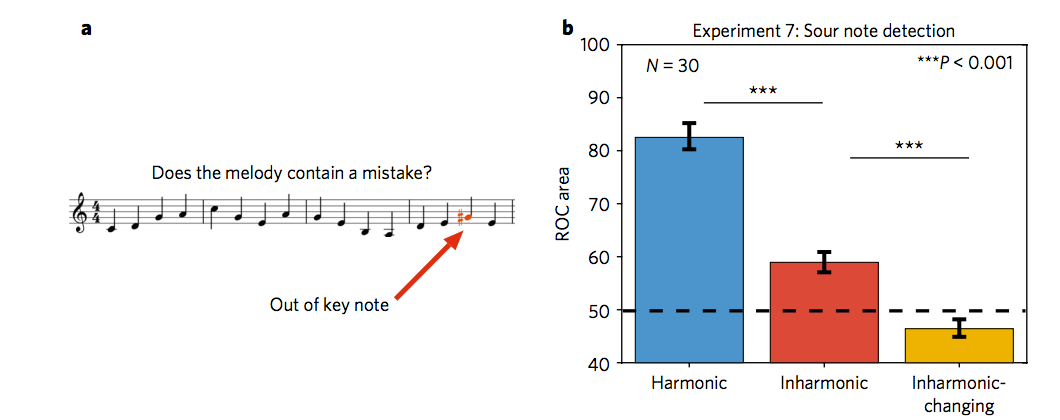
Figure 6. Task and results for Experiments 7 and 8: sour note detection and interval pattern discrimination
(A) Sample trial from Experiment 7. Participants judged whether a melody contained a 'sour' (out of key) note.
(B) Results for Experiment 7. Performance was measured as the area under Receiver Operating Characteristic (ROC) curves. Error bars denote standard error of the mean.
Harmonic
Inharmonic
Inharmonic - Changing
Experiment 8: Interval Pattern Discrimination
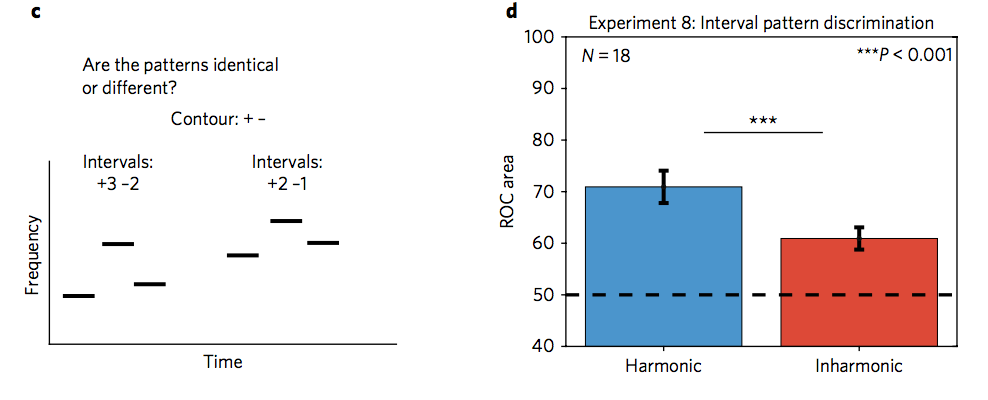
(C) Schematic of a sample trial from Experiment 8. Participants judged whether two melodies were the same or different. On 'different' trials (pictured) the two melodies had different intervals between notes, but retained the same contour. The second melody was always transposed up in pitch relative to the first.
(D) Results for Experiment 8. Performance was measured as the area under Receiver Operating Characteristic (ROC) curves. Error bars denote standard error of the mean.
Harmonic
Inharmonic
Experiment 9: Pitch discrimination with pairs of notes, including larger step sizes
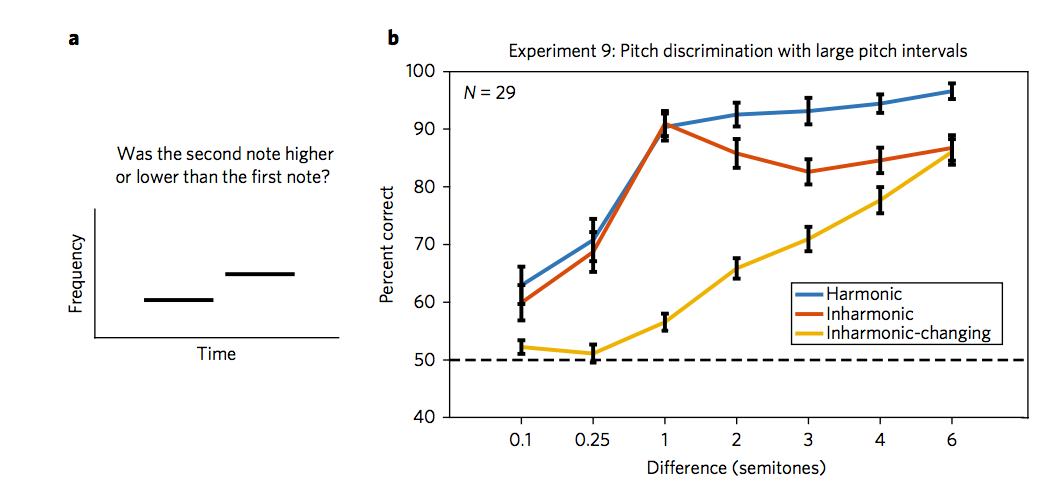
Figure 7. Task and results for Experiment 9, pitch discrimination with pairs of notes, including larger step sizes
(A) Schematic of trial structure for Experiment 9. During each trial, participants heard two notes and judged whether the second note was higher or lower than the first note. The stimuli and task were identical to those of Experiment 1, except larger step sizes were included.
(B) Results from Experiment 9. Error bars denote standard error of the mean.
Harmonic - Six Semitone Shift
Inharmonic - Six Semitone Shift
Inharmonic - Changing Jitter - Six Semitone Shift
Experiment 10a and 10b: Famous Voice Recognition
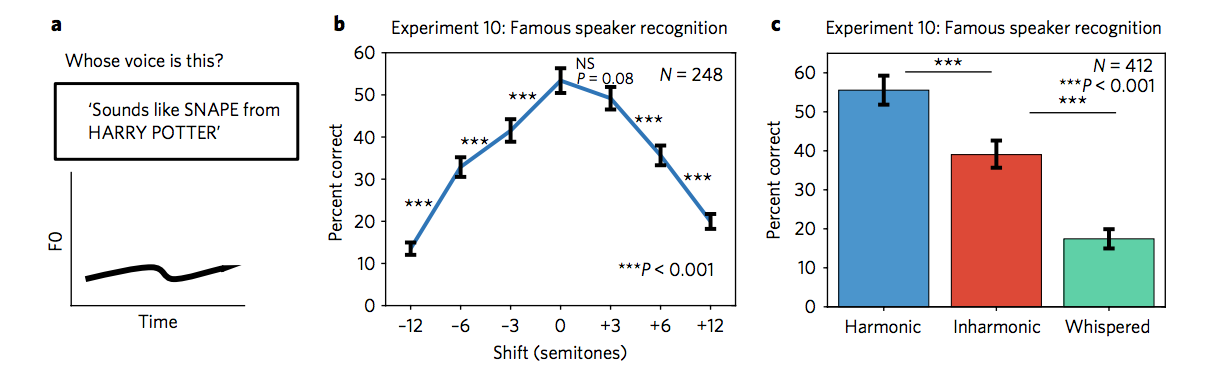
Figure 8. Task and results for Experiments 10a, 10b, and 11: famous speaker recognition and novel voice discrimination (A) Description of Experiments 10a and 10b. Participants on Mechanical Turk heard resynthesized excerpts of speech from recordings of celebrities, and were asked to identify each speaker by typing their guesses into an interface.
(B) Results from Experiment 10a, with harmonic speech pitch shifted between -12 and +12 semitones. Here and in (C), error bars plot standard deviations calculated via bootstrap.
(C) Results from Experiment 10b. Stimuli in the Whispered condition were resynthesized with simulated breath noise, removing the carrier frequency contours.
Experiment 10a
Experiment 10b
Experiment 11: Novel Voice Discrimination
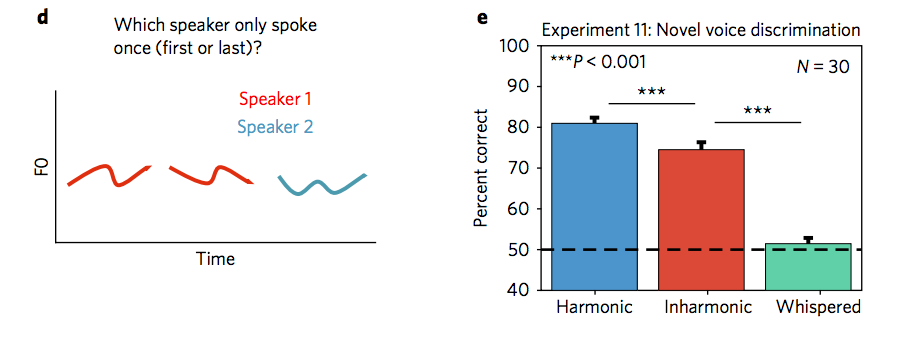
(D) Schematic of trial structure for Experiment 11. Participants heard three one-second resynthesized speech utterances from unknown speakers, the first or last of which was spoken by a different speaker than the other two. Participants judged which speaker (first or last) only spoke once.
(E) Results from Experiment 11. Error bars denote standard error of the mean.
Experiment 11
Stimulus Examples - Supplementary Figures
Supplementary Figure 3: Speech Tone Contour Percpetion
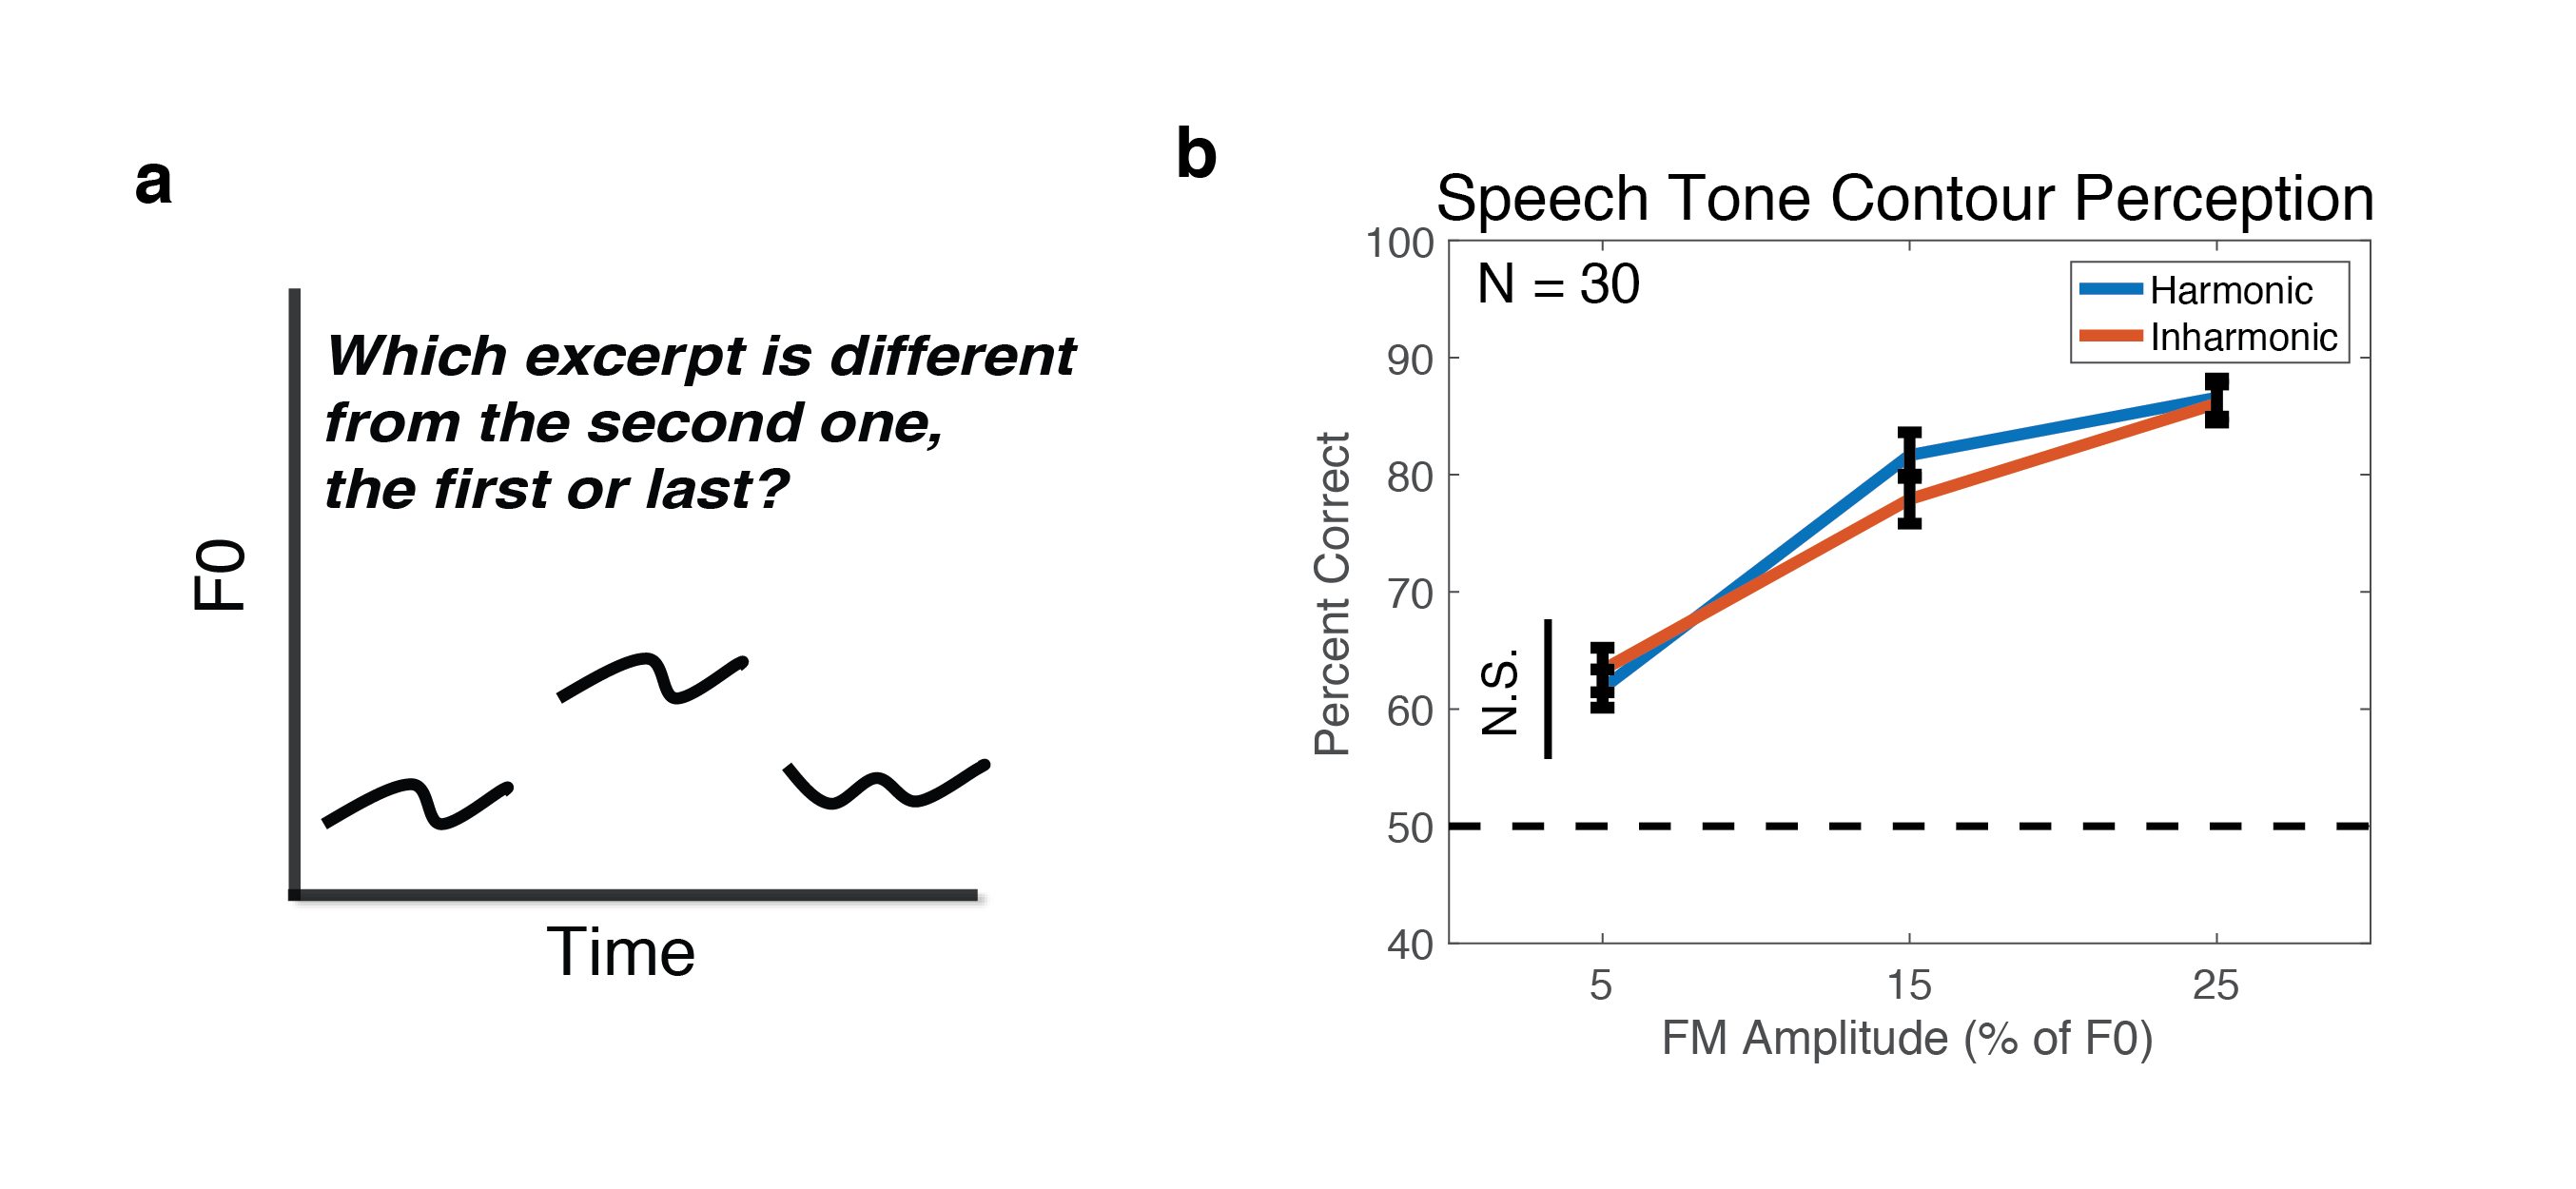
Supplementary Figure 3: Task and results from FM contour discrimination experiment
(A) Schematic of FM Speech Contour Discrimination task. The procedure was identical to that of Experiment 3 except that the F0 contour of the selected speech segment for a trial was extracted using STRAIGHT and used to synthesize harmonic and inharmonic complex tones with the F0 contour of the speech utterance. Participants heard three one-second tone contours, the first or last of which had random frequency modulation added to its F0 contour (the added FM was white noise bandpass filtered between 1-2 Hz, with modulation depth that varied across conditions). Participants were asked whether the first or last tone differed from the second tone, which was transposed up in pitch for all trials. We applied a low-pass filter to the frequency-modulated tones to approximate the natural falloff in amplitude of higher harmonics in speech. This filter was a logistic function in the frequency domain with an inflection point at 4000 Hz and a slope of 40 dB per octave at the inflection point. Because there are breaks in the F0 contour of speech (during unvoiced segments), we applied 10ms half-Hanning windows to avoid clicking at the onsets and offsets of each fragment. If voiced segments shorter than 20ms, they were replaced with silence. Stimuli were high-pass filtered and masked as described in the section on High-pass Filtering and Masking Noise in the Methods).
(B) Results from FM contour discrimination. Error bars denote standard error of the mean. A repeated measures ANOVA was used to assess significance. There was no main effect of harmonicity (F(1,29)=.462, p=0.502).
Harmonic
Inharmonic