Example Stimuli from Consonance Study, page 2
These pages contain example stimuli from the paper "Individual Differences Reveal the Acoustic Basis of Consonance" by McDermott, Lehr, and Oxenham (Current Biology, 2010). The paper can be downloaded here.
Quicktime must be installed for the sounds to play. Headphones are essential for the third page as the stimuli there are
dichotically presented.
**Please note - sound files make take a few seconds to load. If not all sound load, please try refreshing the page.**
Figure 2, parts c-d (Harmonic and Inharmonic tones and their average pleasantness ratings):
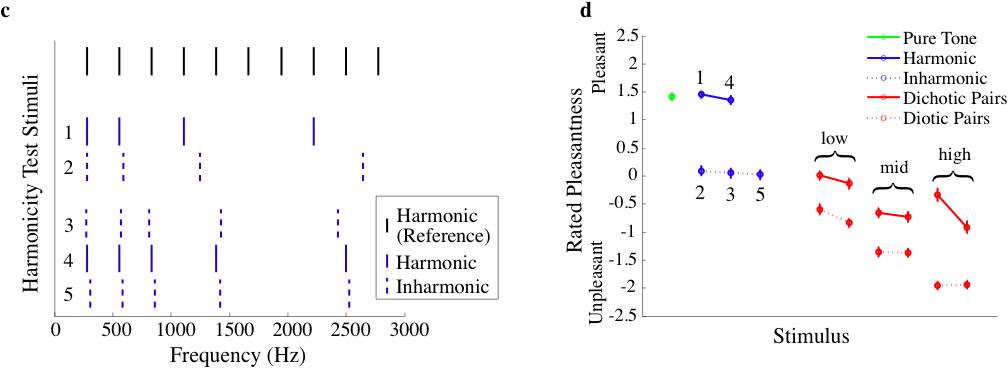
Fig. 2c-d. Harmonicity Test Stimuli. (c) Schematic frequency spectra for harmonicity test stimuli. A typical naturally occurring complex tone has energy at all the harmonics. Such a tone is shown in black at the top. To minimize beating in these test stimuli, the harmonic tones (solid blue) contained a subset of the harmonic frequencies. The inharmonic tones (dashed blue) were generated via small perturbations to the frequencies of the harmonic tone components. All other aspects of the harmonic and inharmonic stimuli were identical. (d) Mean pleasantness ratings of harmonicity test stimuli as well as some others from the study (see third page of examples).
Example harmonic tones:
| Stimulus 1: | Stimulus 4: |
Example inharmonic tones:
| Stimulus 2: | Stimulus 3: | Stimulus 5: |
There were two main findings of this study. The first was that the size of the preference for harmonic over inharmonic tones predicted the size of the preference for consonant over dissonant chords, suggesting that consonance derives from harmonicity. The second is that both harmonicity preferences and consonance preferences were correlated with the number of years a person had spent playing an instrument, suggesting that the preferences are enhanced by exposure to music.
First Page of Stimuli Third Page of Stimuli
Back