This page contains the sound examples used in a paper that appeared in Current Biology.
NOTE: As always with sound demos, headphones are a much better bet than computer speakers.
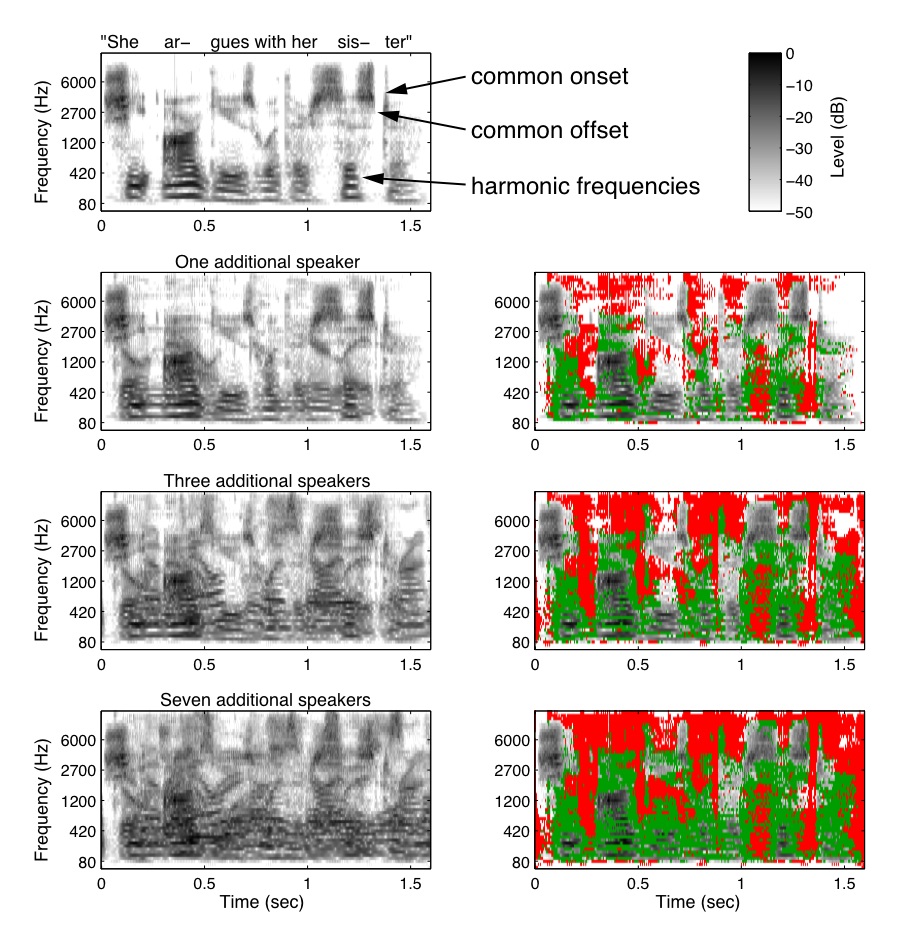
Figure 2 (from paper). Cocktail party acoustics
Spectrograms of a single "target" utterance (top row), and the same utterance mixed with one, three, and seven additional speech signals from different speakers. The mixtures approximate the signal that would enter the ear if the additional speakers were talking as loud as the target speaker, but were standing twice as far away from the listener (as might occur in cocktail party conditions). Spectrograms were computed from a filter bank with bandwidths and frequency spacing similar to those in the ear. Each spectrogram pixel represents the rms amplitude of the signal within a frequency band and time window. The spectrogram thus omits local phase information, which listeners are insensitive to in most cases. The grayscale denotes attenuation (in dB) from the maximum amplitude of all the pixels in all of the spectrograms, such that gray levels can be compared across spectrograms. Acoustic cues believed to contribute to sound segregation are indicated in the spectrogram of the target speech (top row). Spectrograms in the right column are identical to those in the left except for the superimposed color masks. Pixels labeled green are those where the original target speech signal is more than -50 dB but the mixture is at least 5 dB higher. Pixels labeled red are those where the target was less and the mixture was more than -50 dB in amplitude.
| Single Speaker: | |
| Two Speaker Mixture: | |
| Four Speaker Mixture: | |
| Eight Speaker Mixture: |
For further details, please check out the paper.