Sequential grouping (Figure 7)
Click the cochleagrams in the figures to hear the corresponding sound.
Frequency proximity (Tougas and Bregman, 1985)
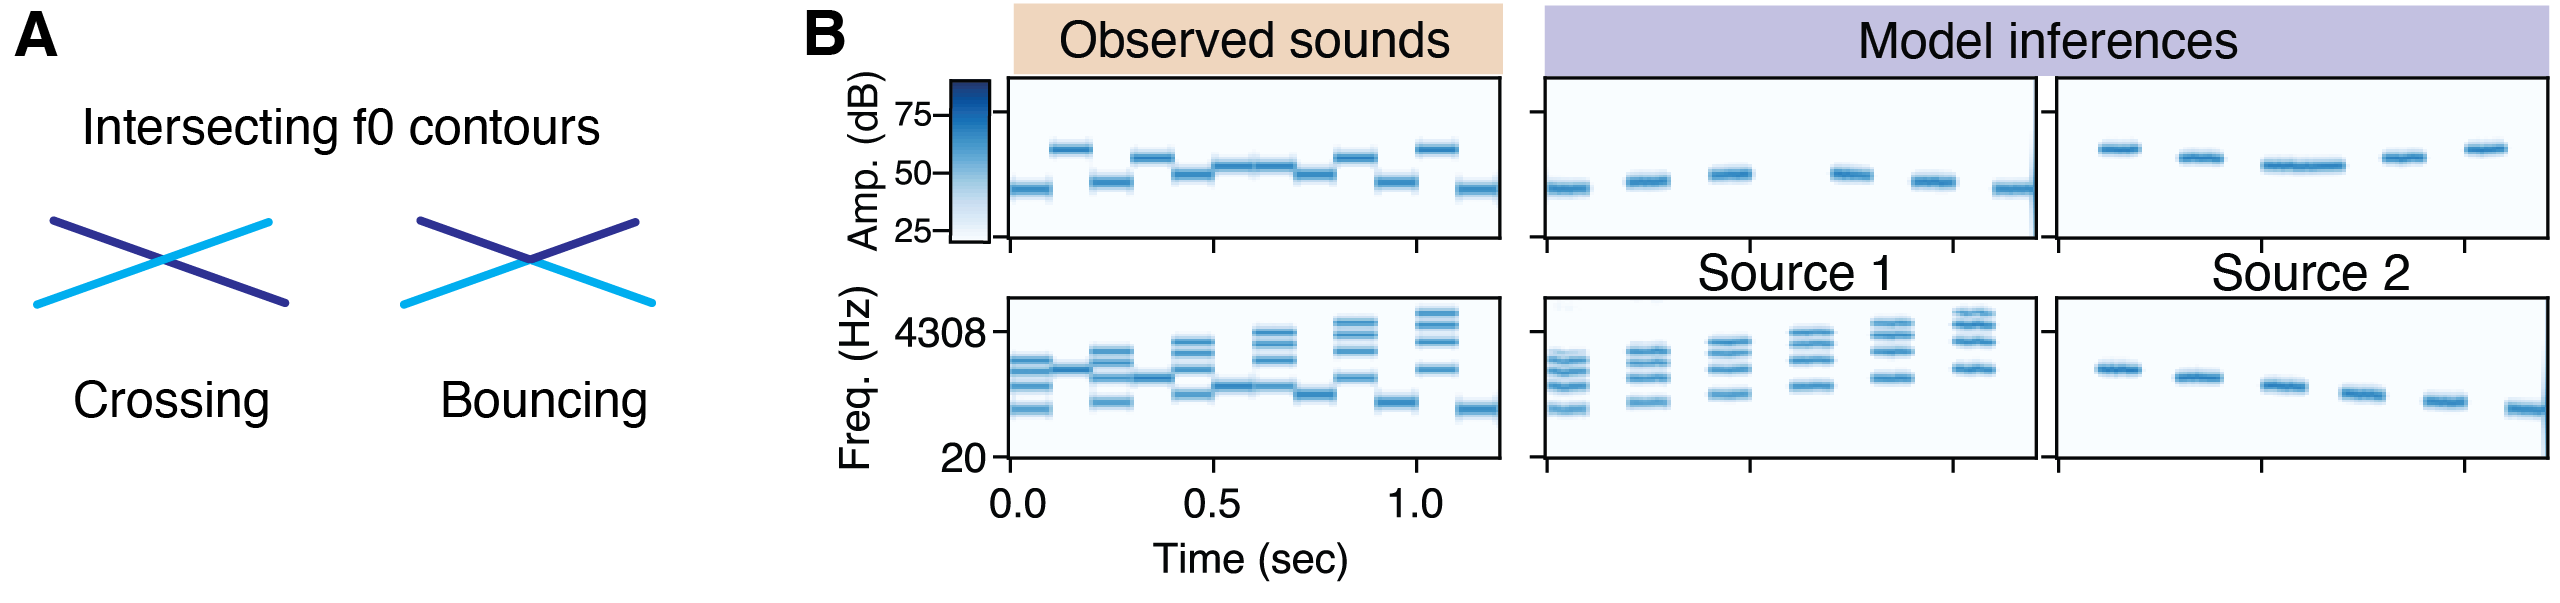
To demonstrate the role of frequency proximity in sequential grouping, Tougas and Bregman (1985) interleaved rising and falling tone sequences, producing the "X" pattern apparent in Figure 7A. Listeners found it difficult to hear rising or falling trajectories in the mixture. Instead, listeners heard the higher frequency tones as segregated from the lower frequency tones, producing two sequences that "bounce" and return to their starting points. When the pure tones in the rising trajectory are replaced by harmonic tones, listeners hear the crossing explanation.
Click the figure above to hear the experimental stimuli and the model inferences.
Bistability (van Noorden, 1975)
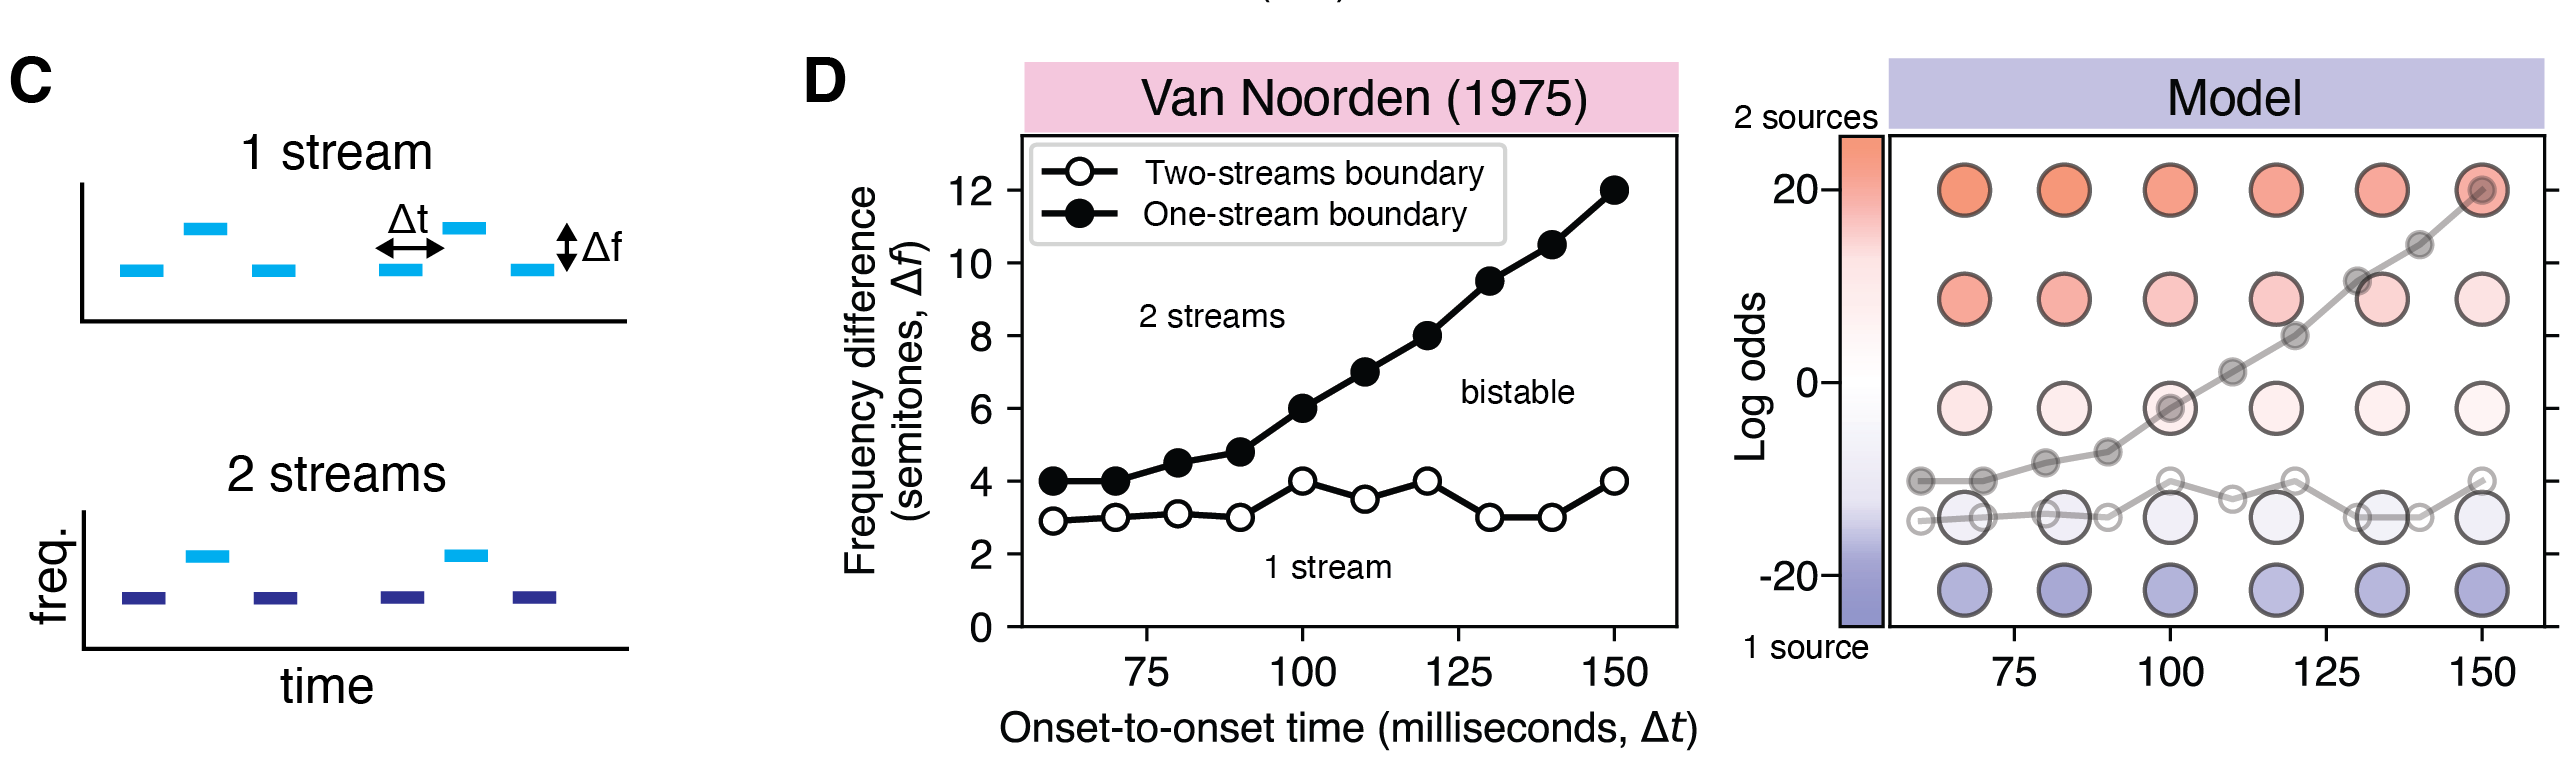
Van Noorden (1975) demonstrated bistability in auditory perceptual organization with the now-classic "ABA sequence" (Figure 7C). This sequence comprises a repeating set of three tones, where the first and last have the same frequency.
Depending on several stimulus parameters as well as the experiment instructions, participants typically hear one of two dominant potential organizations. In the one-source percept, all the tones are grouped together to produce a galloping rhythm.
In the two-streams percept, the A tones are grouped separately from the B tones, such that there are two sequences which each produce an isochronous rhythm (a steady pulse).
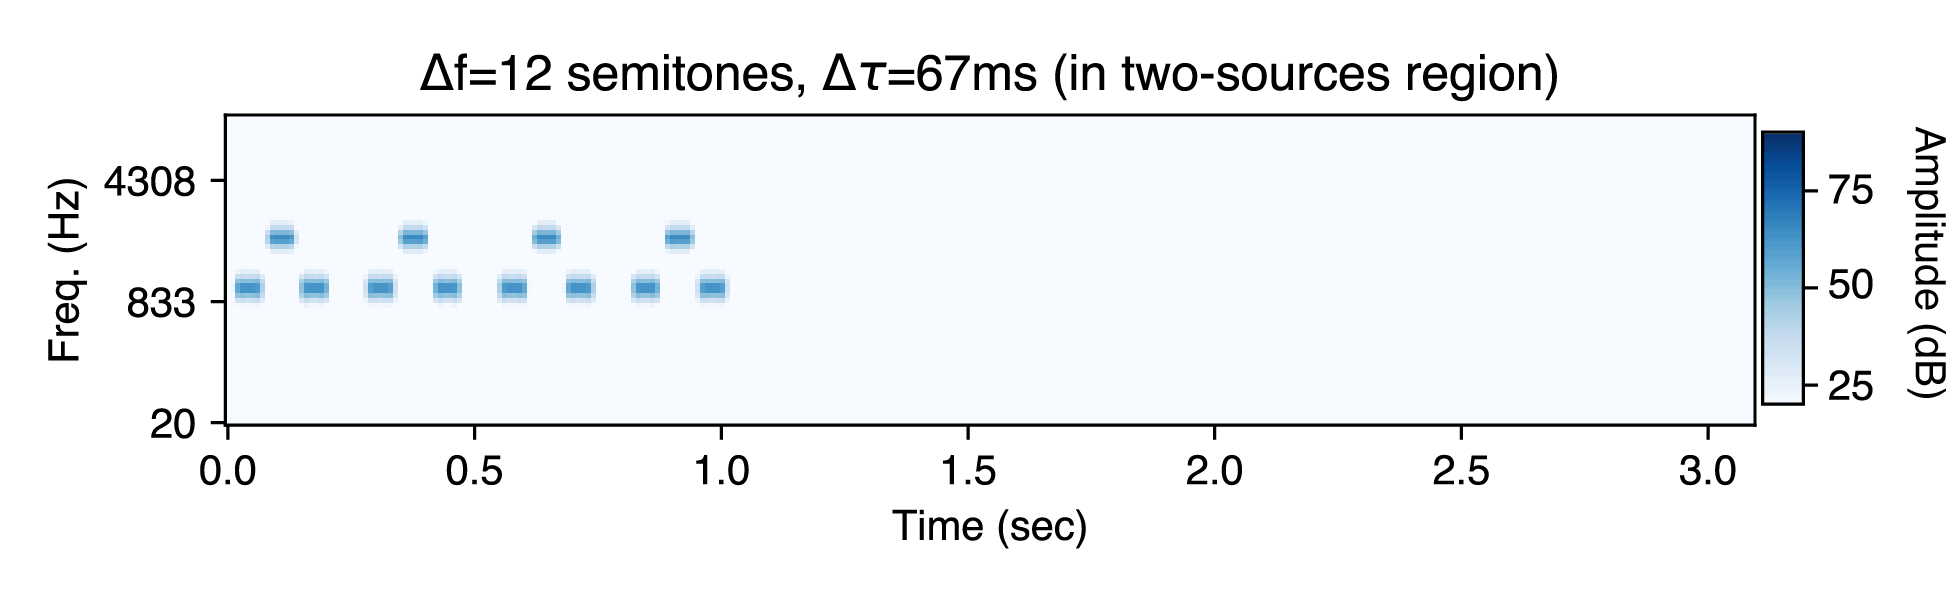
van Noorden showed that increasing the frequency difference between A and B (Δf), and increasing the temporal rate of tones (Δτ), both increase reports of the "two-streams" percept. For high Δf and low Δτ, the "two-streams" percept becomes inevitable. Here is an example experimental stimulus with Δf=12 semitones and Δτ=67ms. Notice the two isochronous rhythms, one slow and one fast.
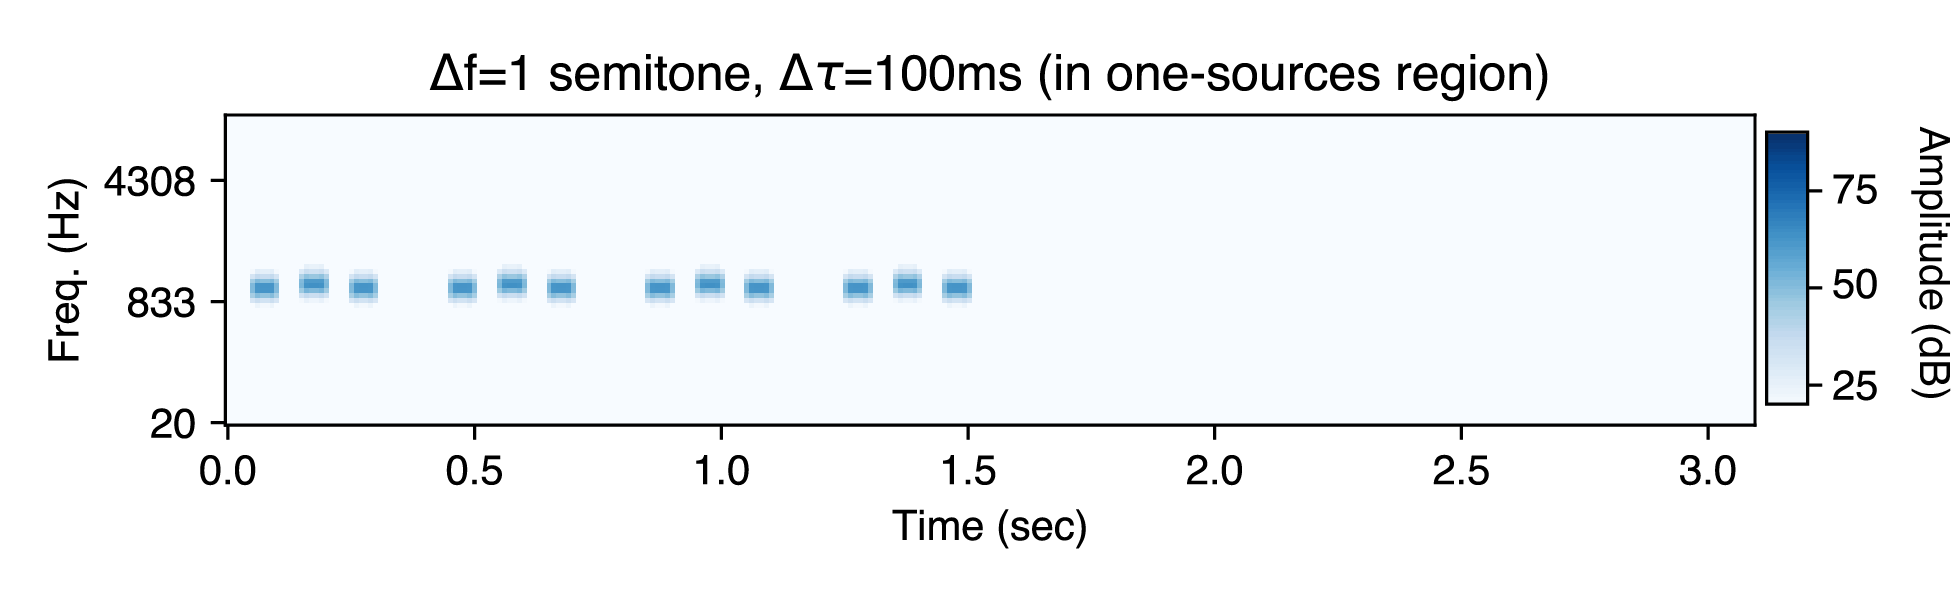
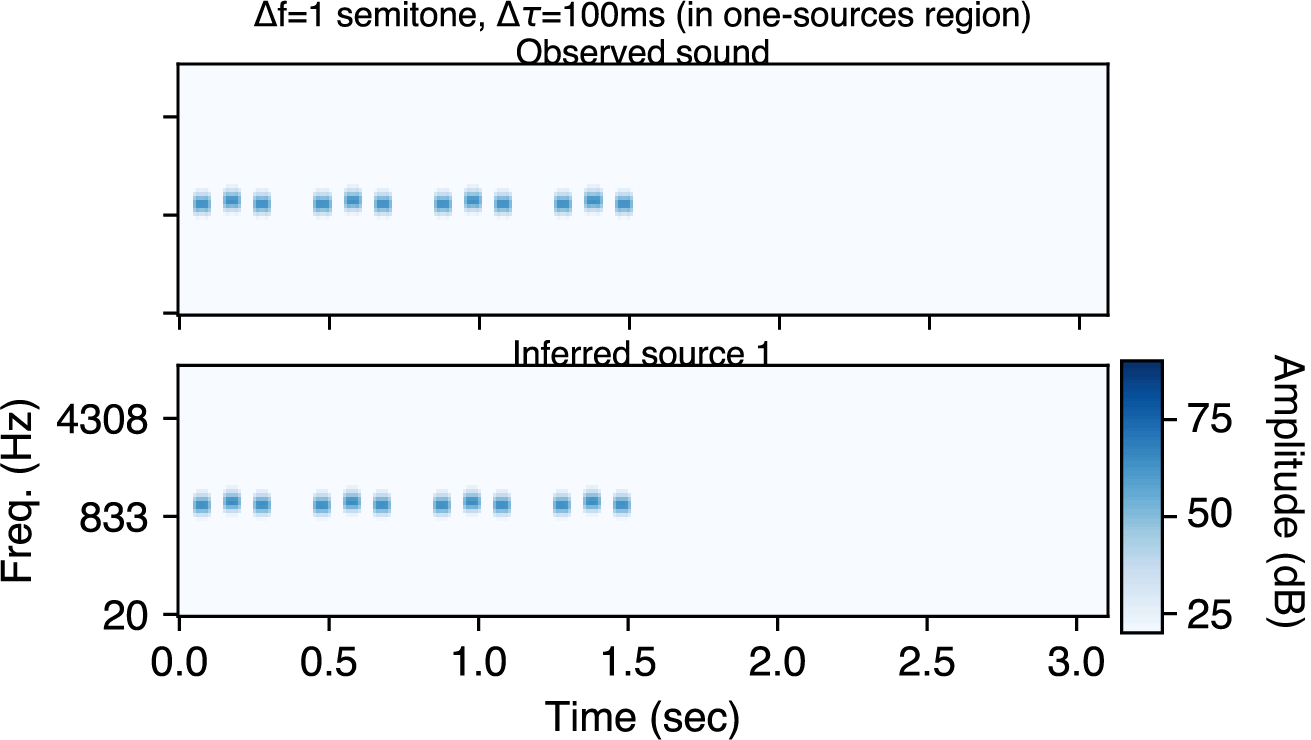
In the low Δf region, the "one-stream" percept is inevitable. Here is an example experimental stimulus with Δf=1 semitone and Δτ=100ms. Notice the galloping rhythm.
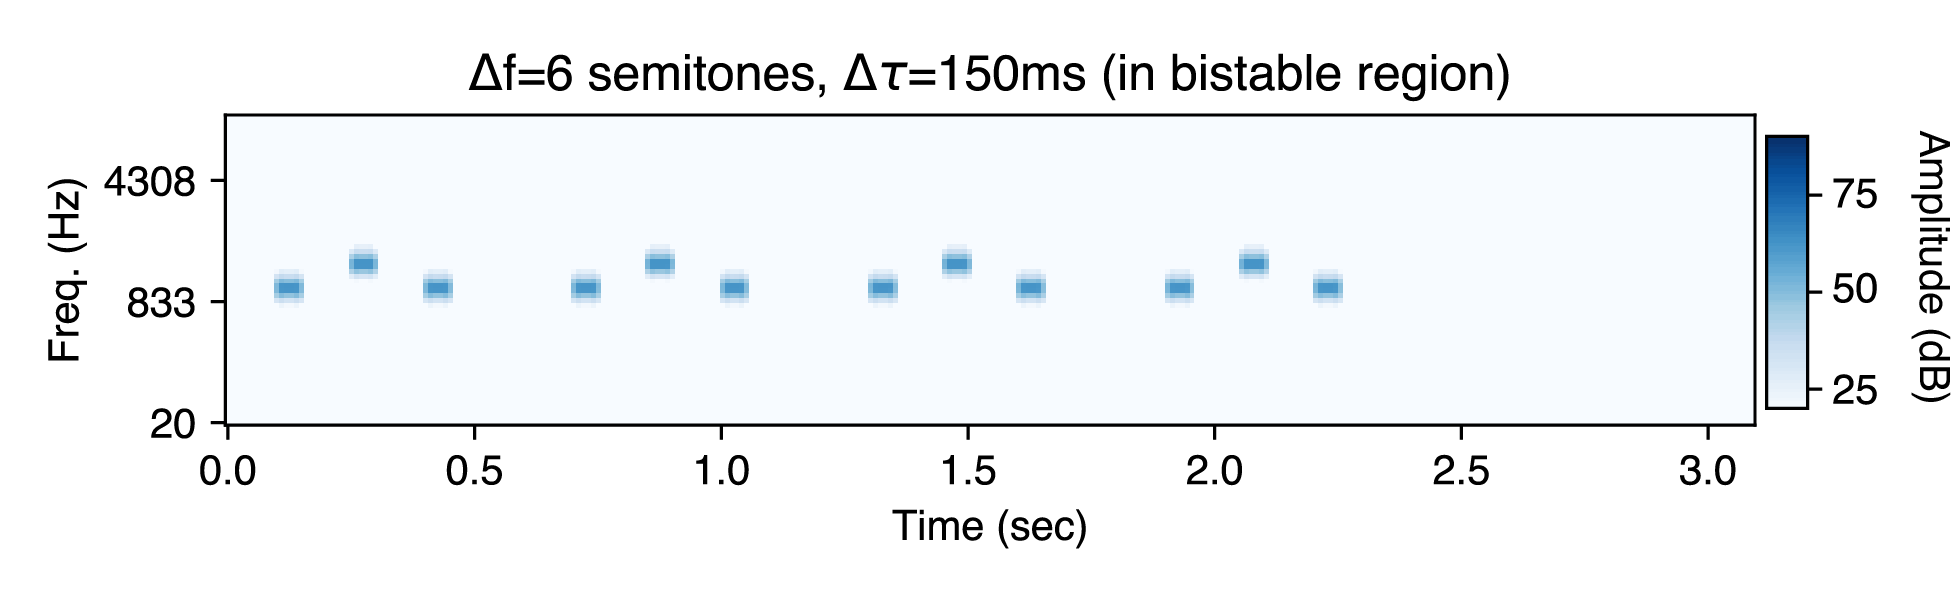
In between these regions, the percept is bistable (either "one-stream" or "two-streams"). Here is an example experimental stimulus with Δf=6 semitones and Δτ=150ms. Notice that you can hear either percept depending on which rhythms you attend to.
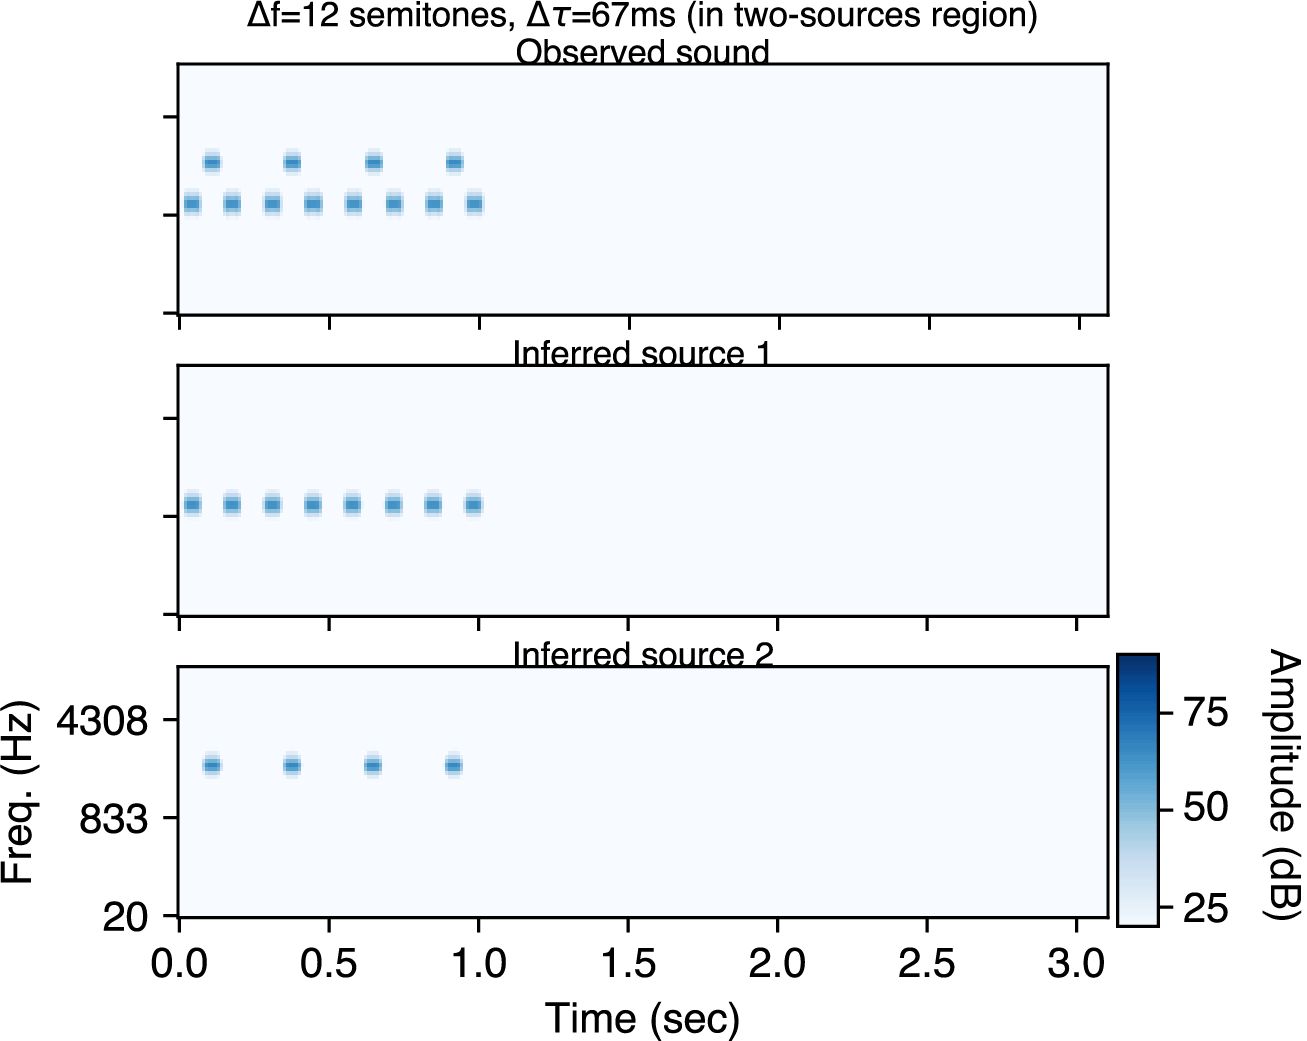
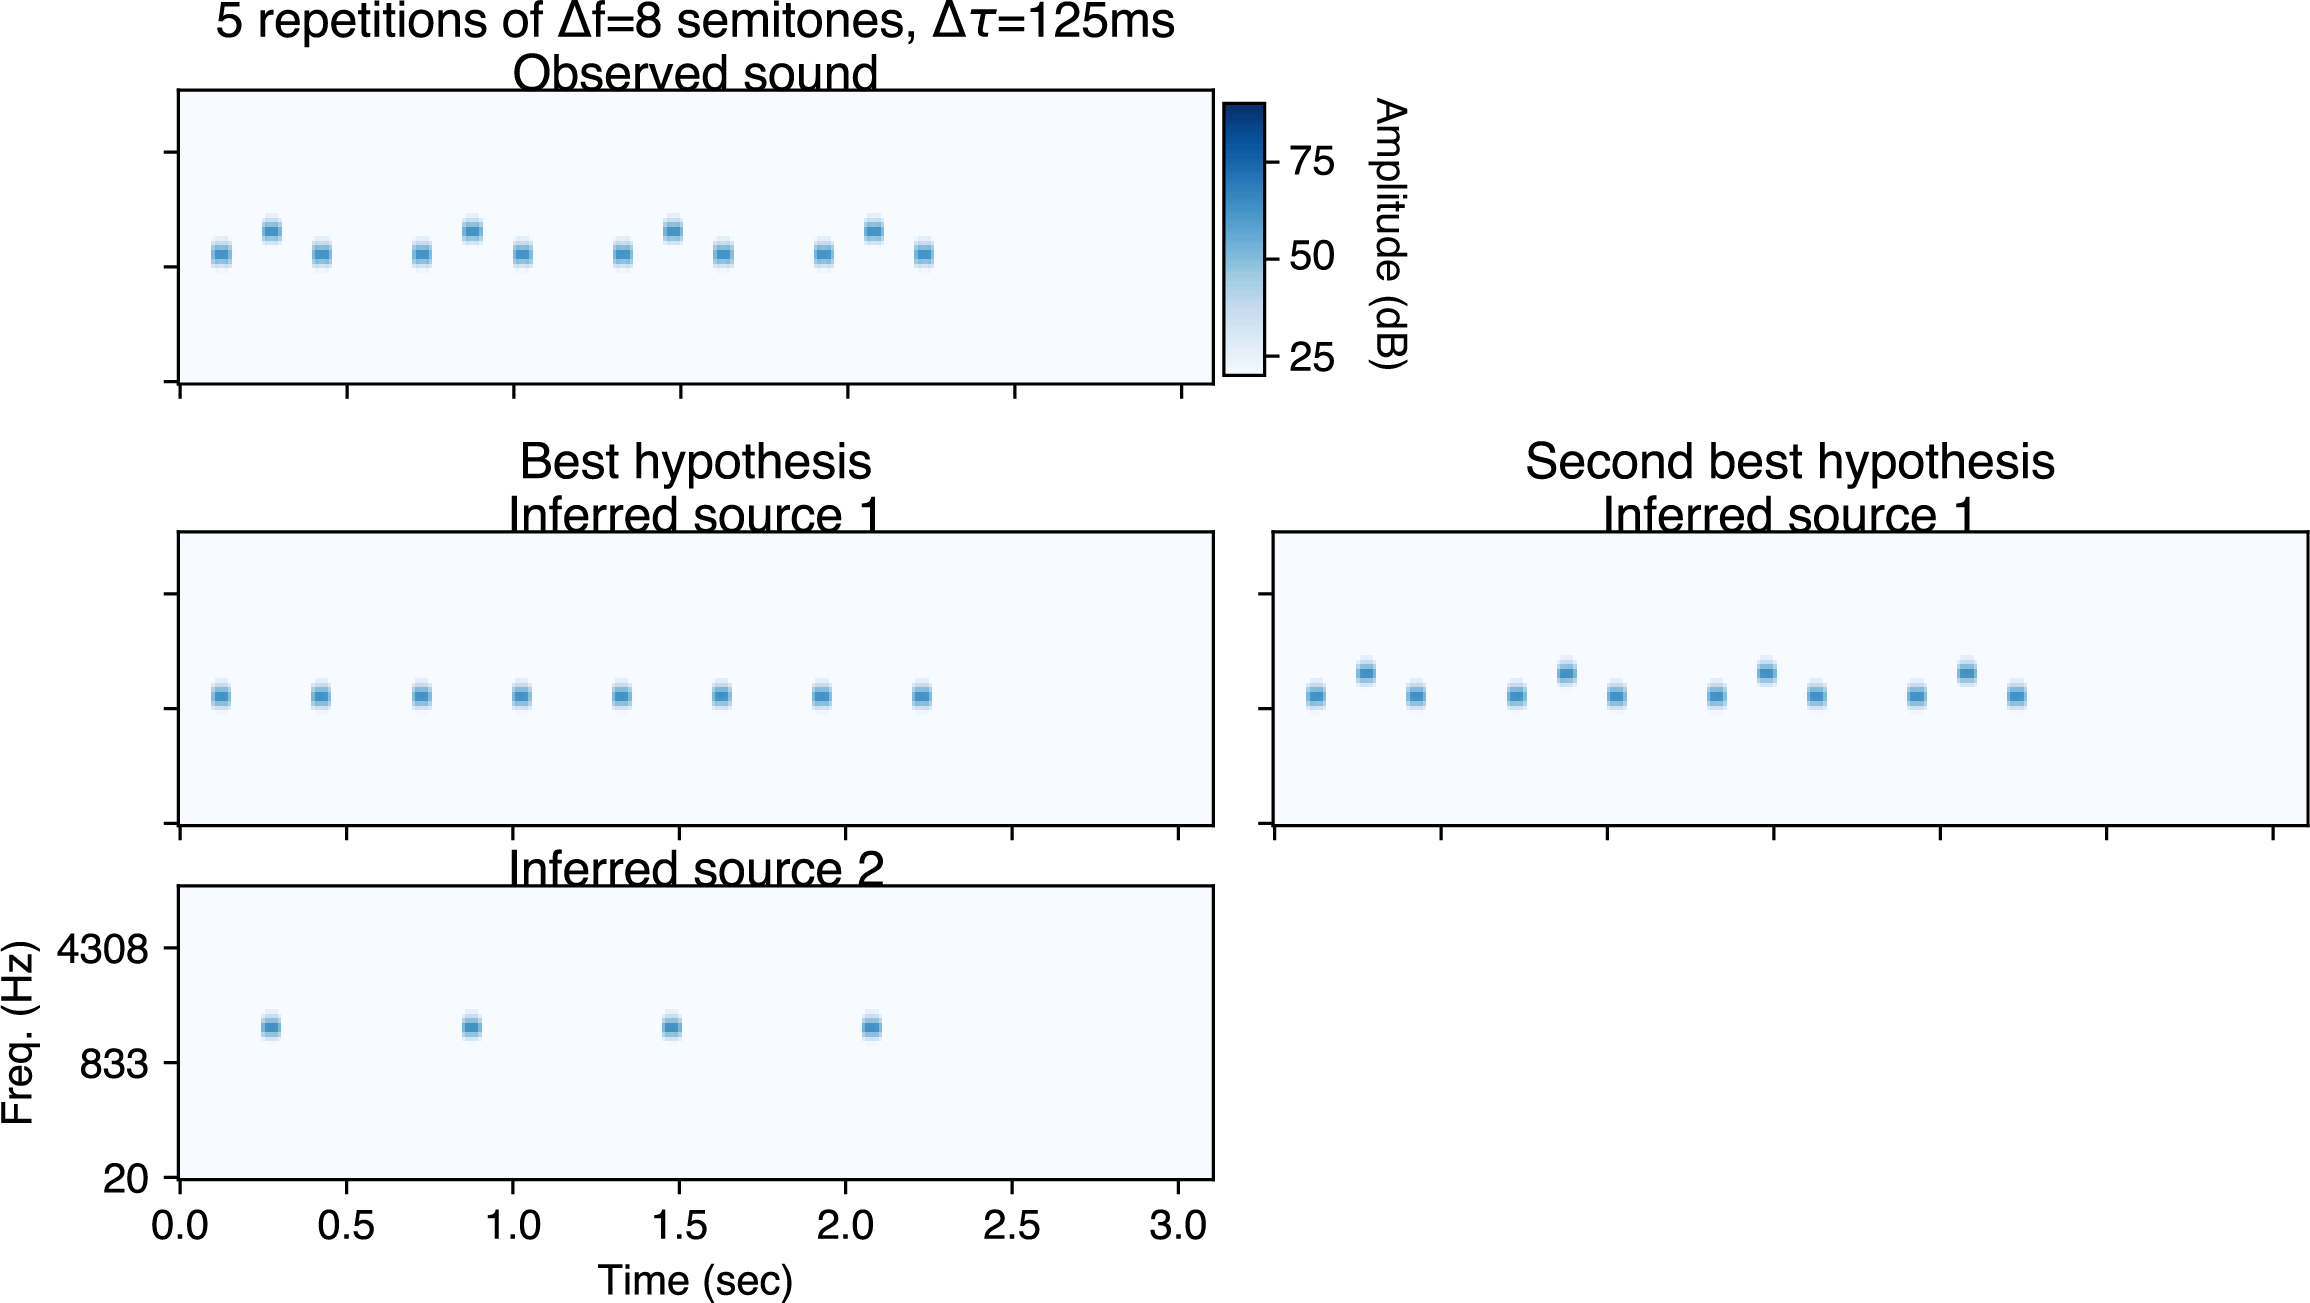
Finally, the following are model inferences (using sequential inference). For high Δf and low Δτ, the model infers two sources.
For low Δf, the model infers one source.
In this last model inference, we display the top two hypotheses. For Δf=6 semitones and Δτ=150 ms, the hypothesis with one source and the hypothesis with two sources have similar posterior probabilities.
Buildup of streaming (Bregman, 1978; Thompson et al., 2011)
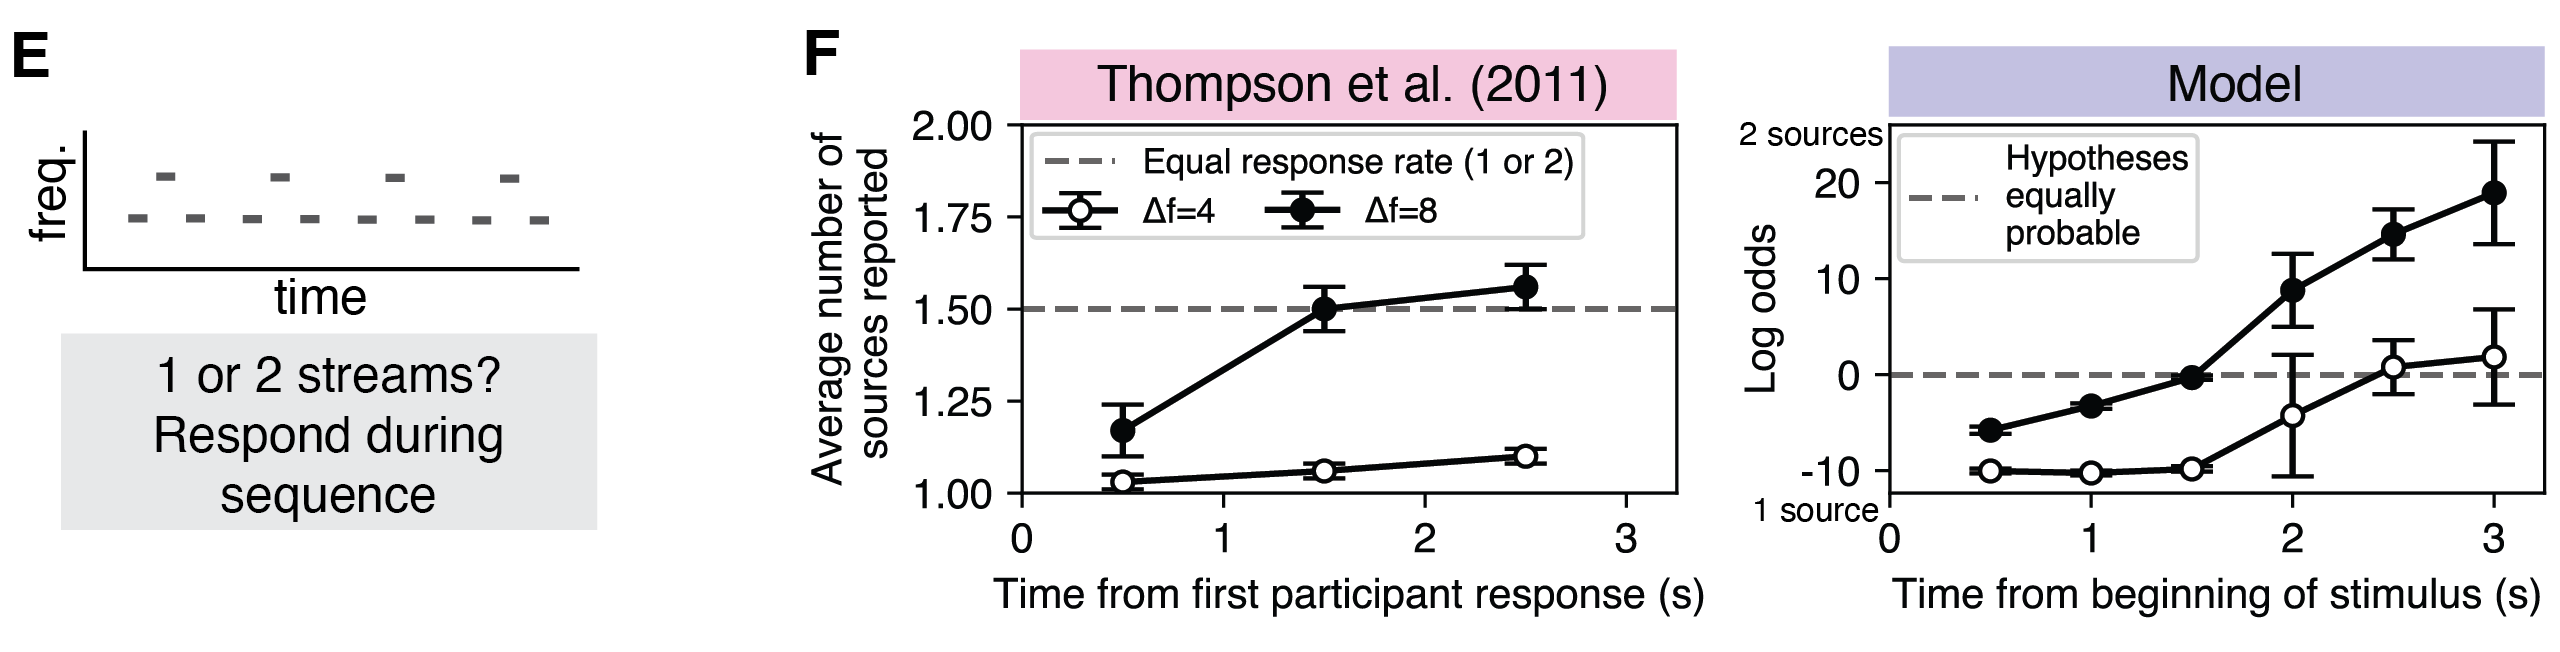
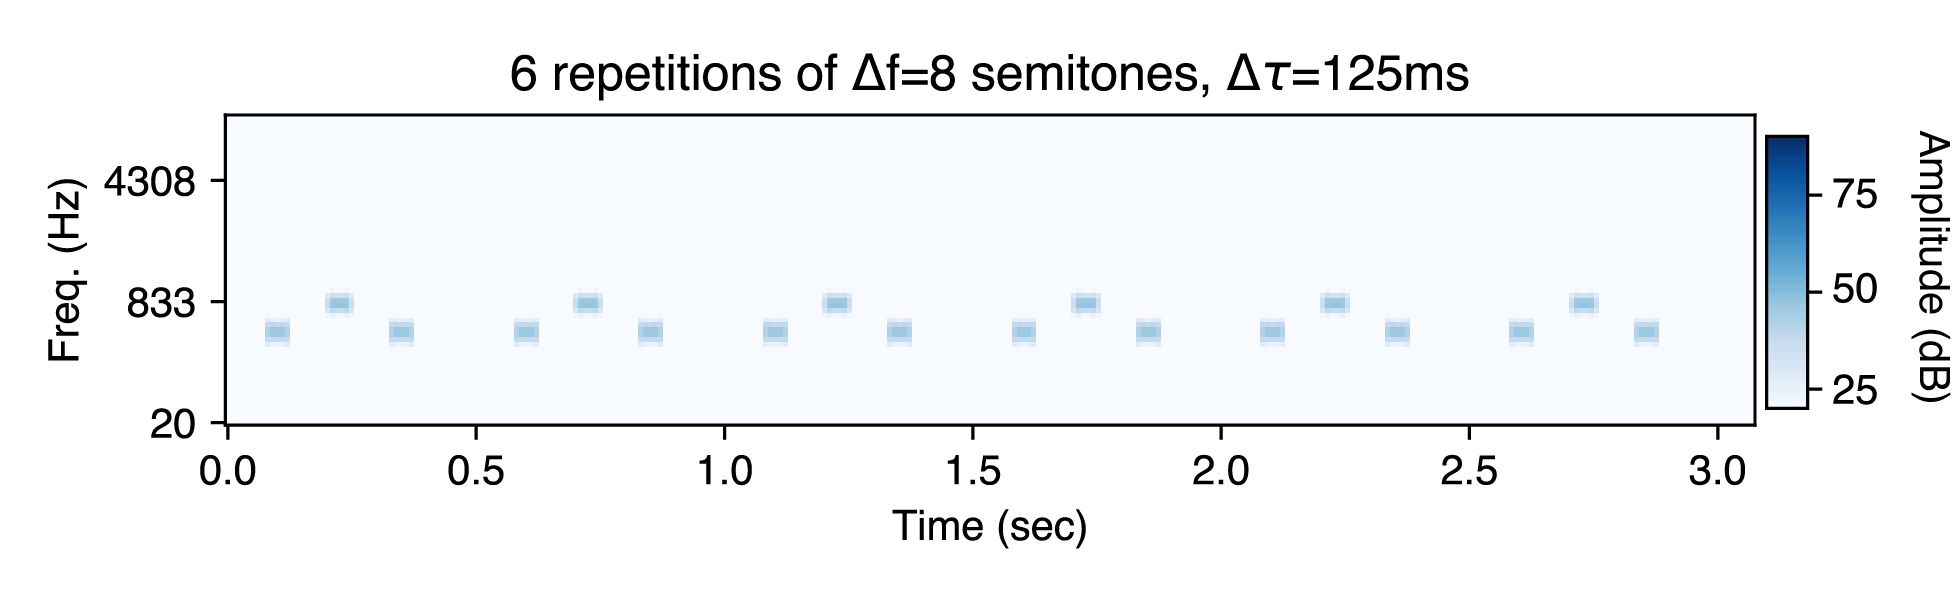
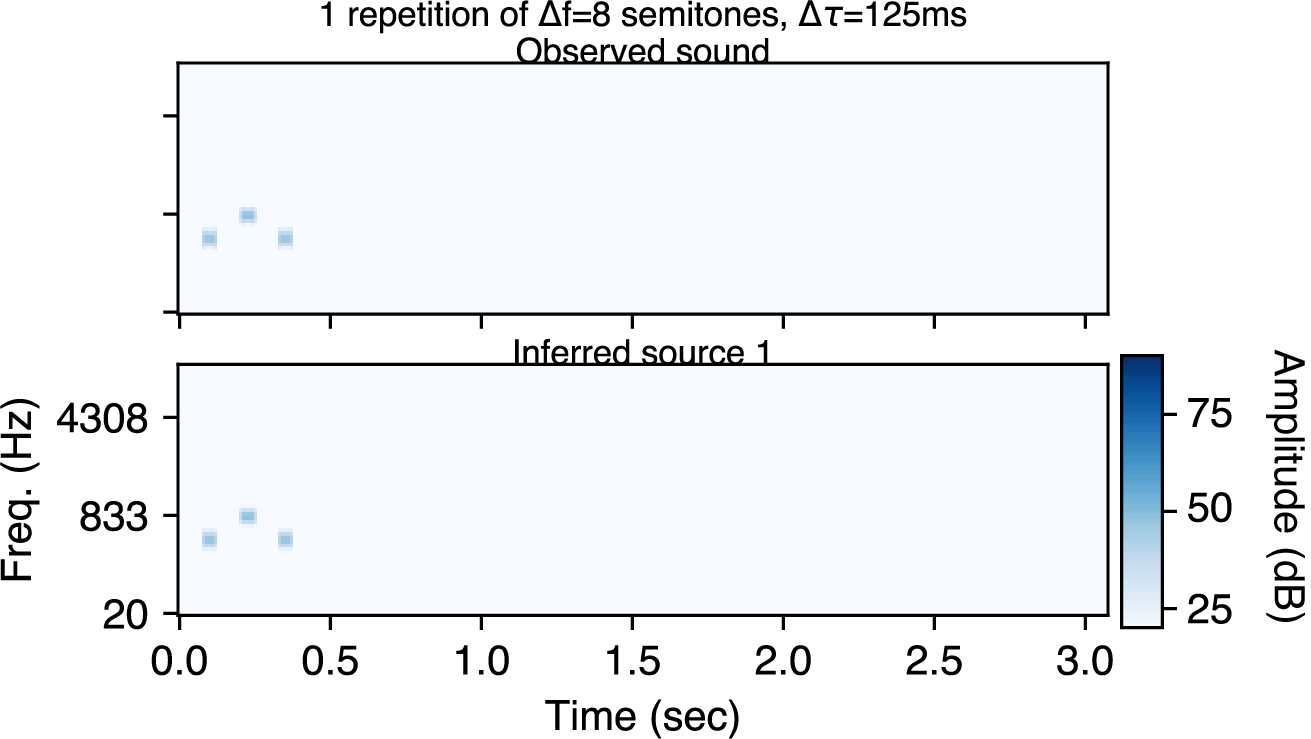
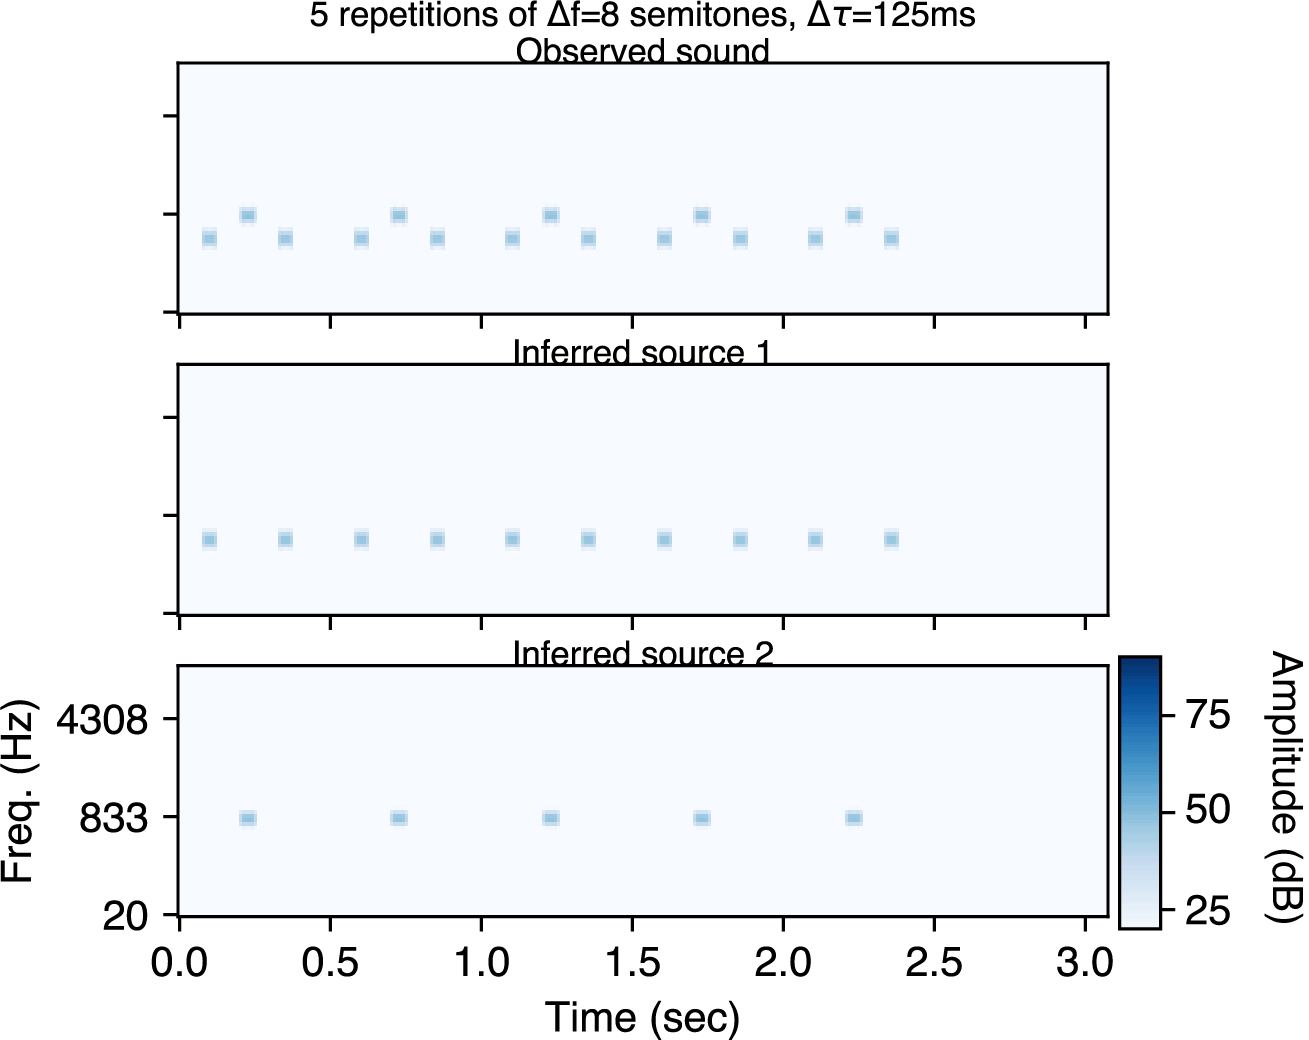
Another factor affecting the preferred perceptual organization of the ABA sequence is the number of repetitions. When an ABA triplet is repeated multiple times over several seconds, listeners increasingly tend toward hearing two sources. Notice how the two source percept emerges with increasing repetitions in this example experimental stimulus (we repeat the sequence twice for a total of 12 reps):
Finally, the following are model inferences (using sequential inference). With one repetition, the model infers one source.
With five repetitions, the model infers two sources.
Effects of context (1) (Bregman, 1978)
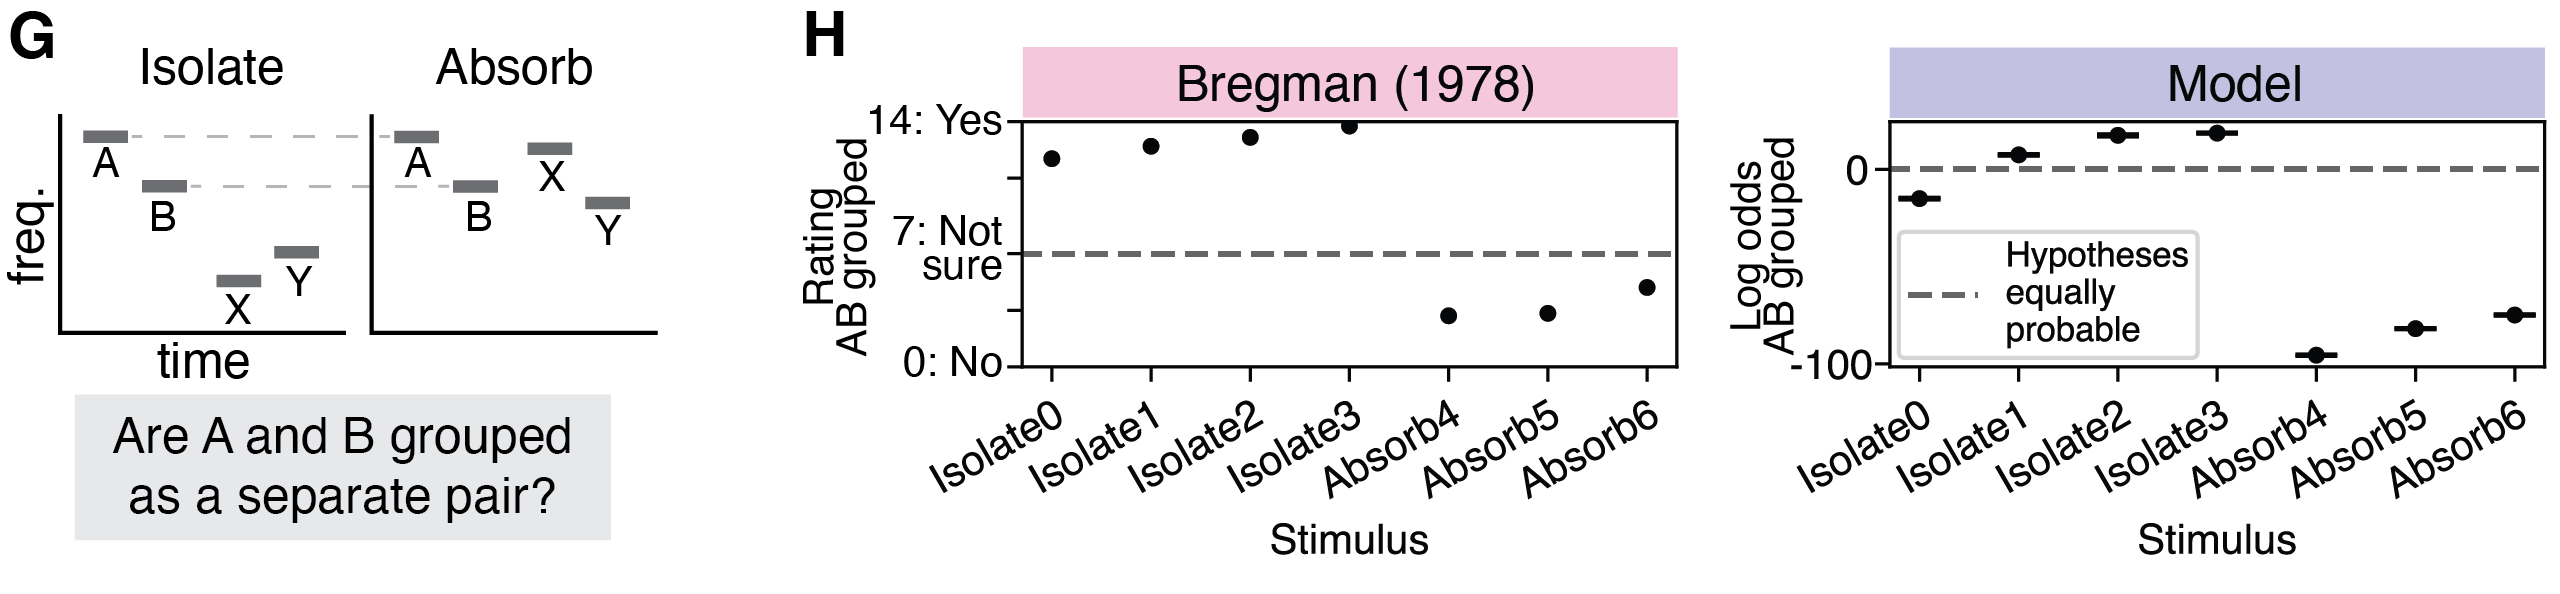
Even when the relative timing and frequency between two tones are fixed, the surrounding context can alter whether the tones are grouped or not.
In this experiment, there were two kinds of tone sequences: "isolate" sequences where X and Y were in a separate frequency range from A and B, and "absorb" sequences where all tones were in the same frequency range. Listeners rated whether it was easy to hear tones A and B as a separate pair. Here is an example experimental stimulus in the isolate condition (A and B are the two low tones):
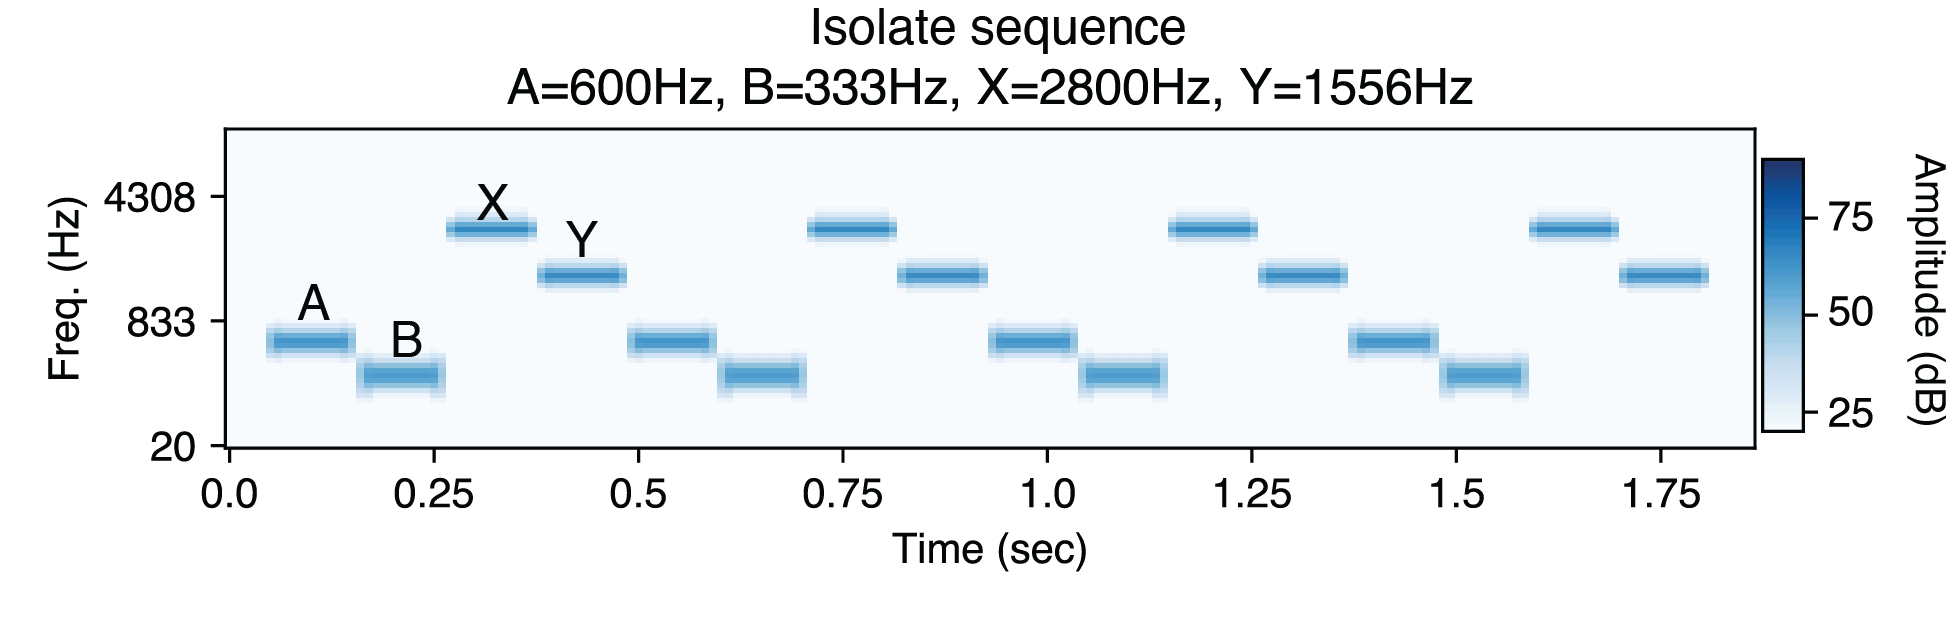
Here is an example experimental stimulus in the absorb condition. Notice it is hard to hear the same two low tones as in the isolate stimulus.
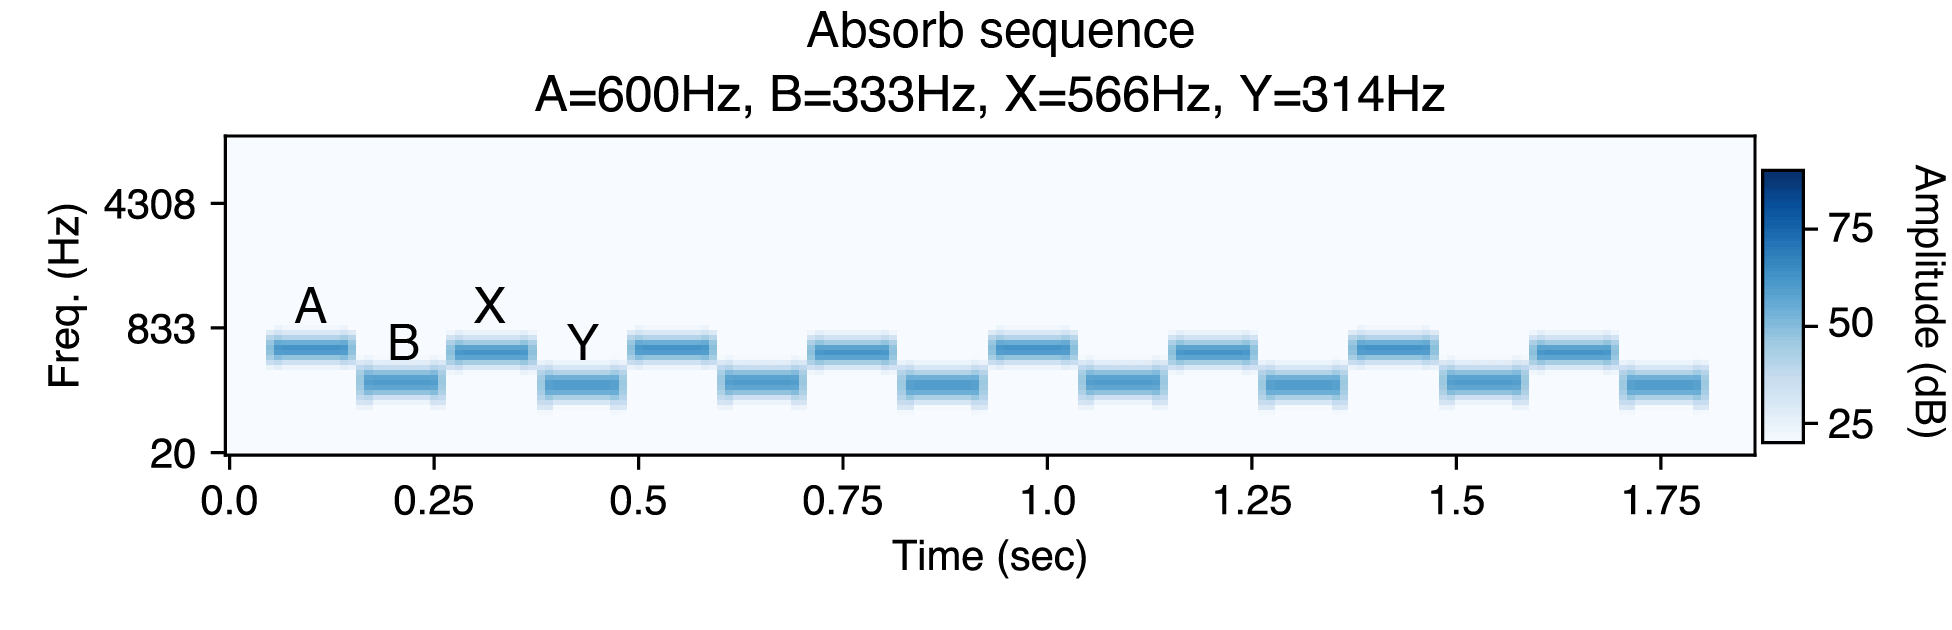
Listeners find it easier to hear A and B as a separate pair in the isolate condition.
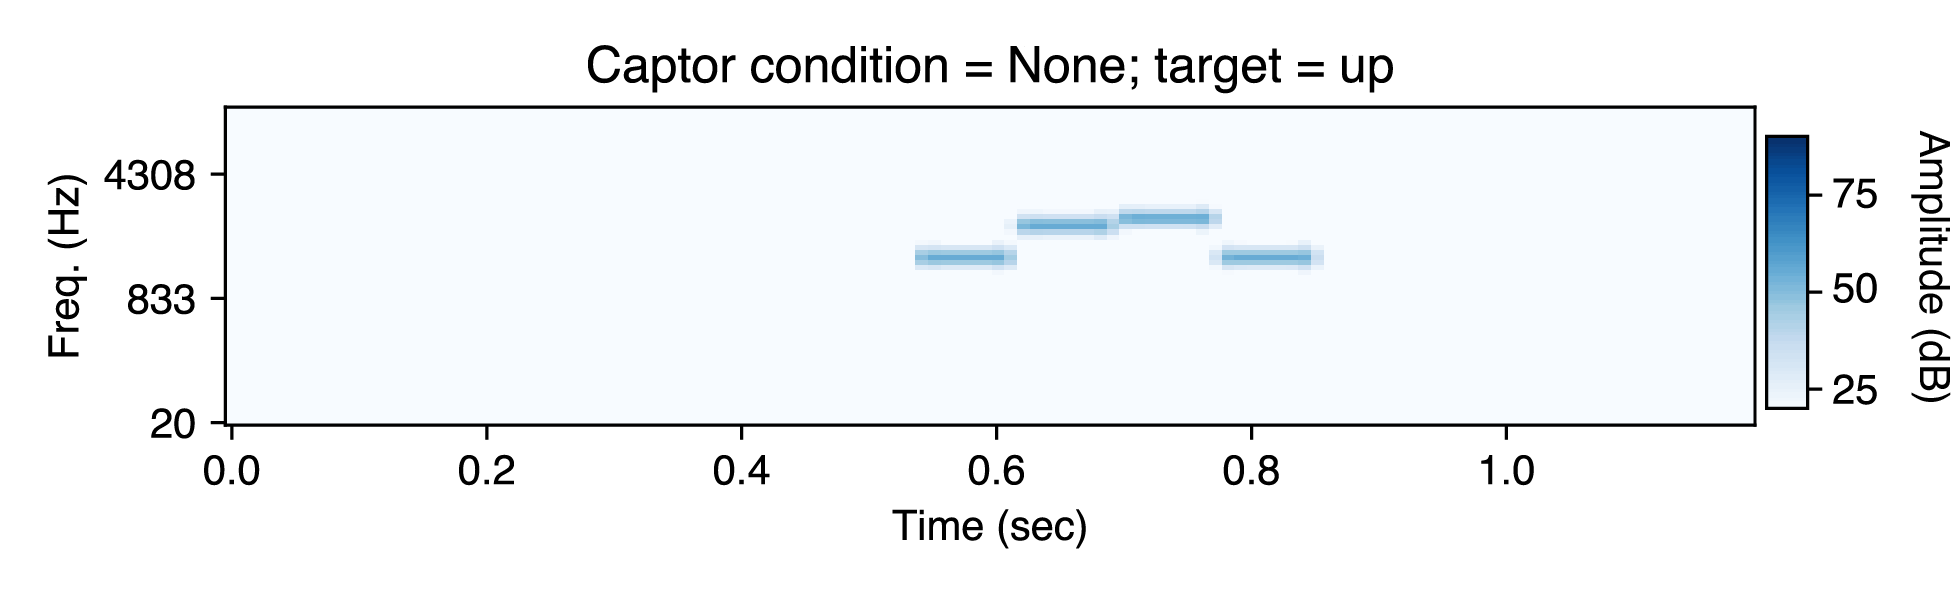
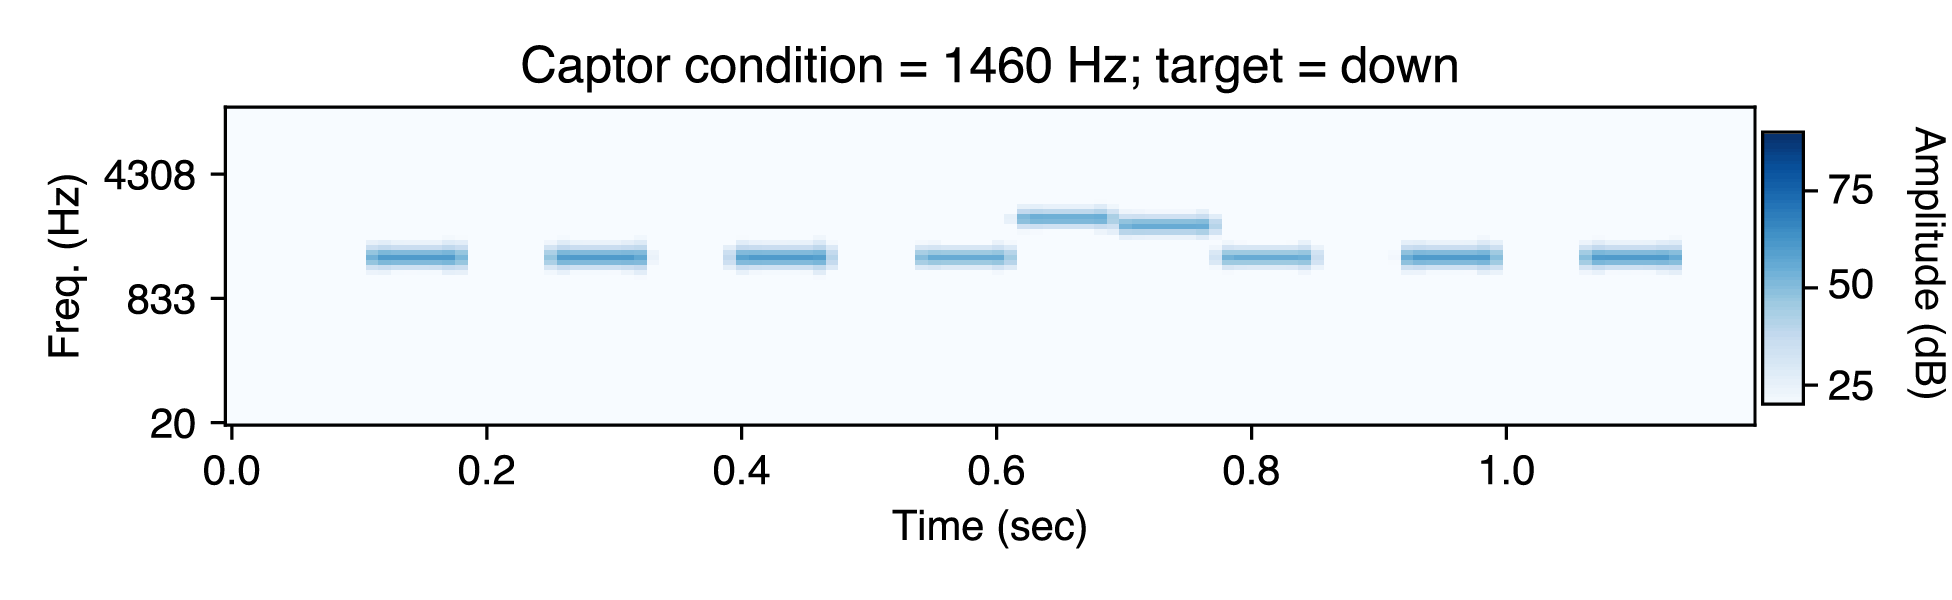
Effects of context (2) (Bregman and Rudnicky, 1975)
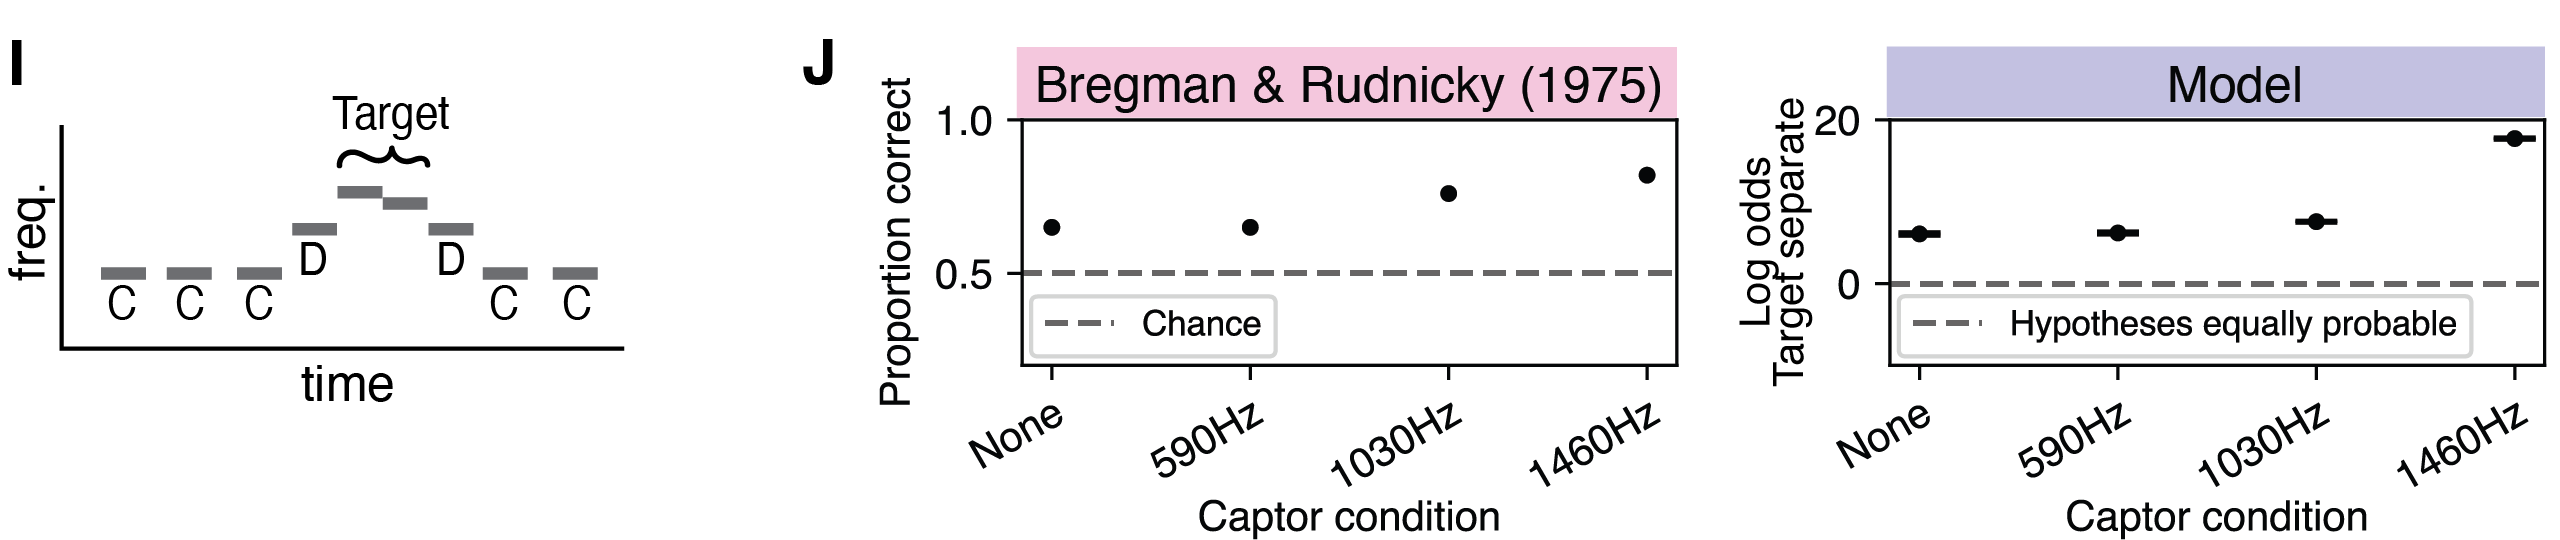
In this experiment, the frequency of the captor tones ("C") affects whether listeners hear the distractor tones ("D") group with the target tones ("T"). Listeners had to judge whether the two tones of the target move upward or downwards in pitch. They were more accurate when the frequency of the captor tones was close to the frequency of the distractor tones (at 1460 Hz), presumably because the distractor tones then group with the captor tones, making it easier to hear out the target tones. Here are example experimental stimuli: