Spectral Completion Demo Page
This page contains demos of phenomena from a paper that appeared in PNAS. Our findings indicate that the auditory system uses the
audible portions of an object's spectrum to infer the
portions that are likely to have been masked, and that are
thus not veridically present in the input to the auditory system.
In the paper we depicted the stimuli with schematic spectrograms. Here
we will show these in addition to actual spectrograms of the stimuli.
NOTE: If you play these demos over the sorts of speakers that typically
accompany computers, they may not work very well. Headphones are a much
better bet.
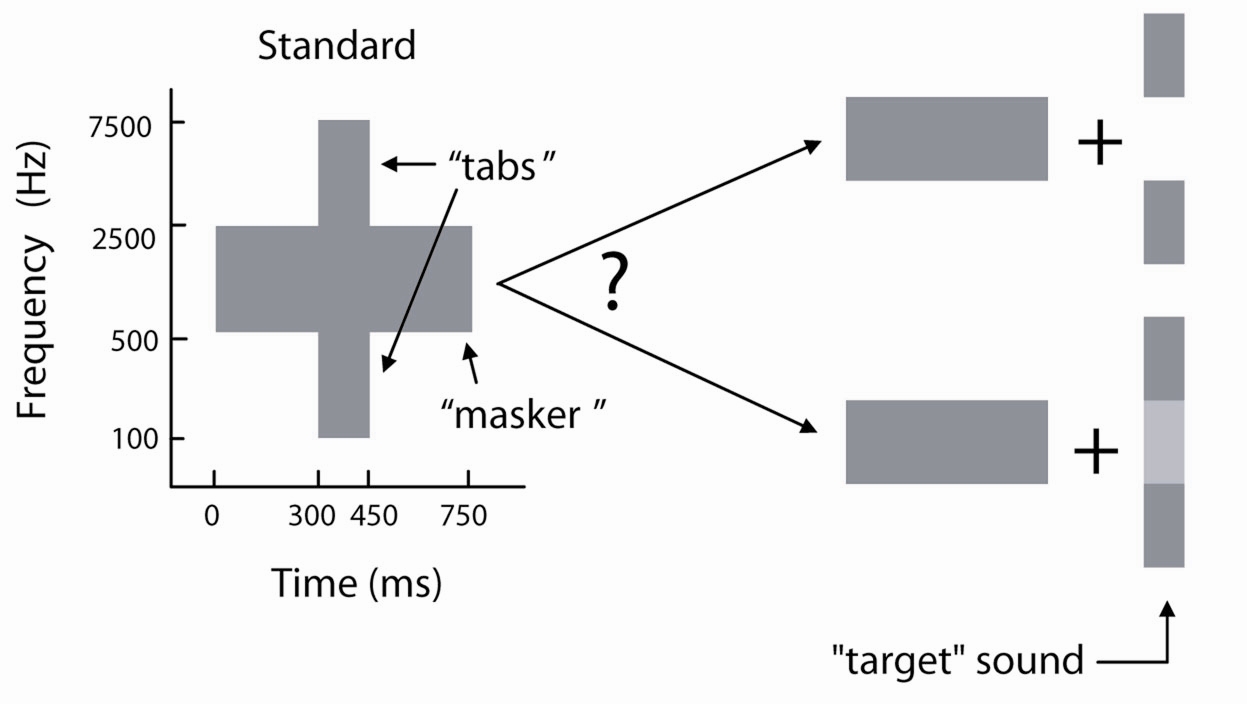
We begin with a stimulus constructed from noise filtered into three
frequency bands. The middle band onsets earlier and offsets later than
the high and low bands. These differences in onset and offset would be
expected to yield the percept of two sounds, one long and one short,
and indeed that is what listeners report hearing. The spectrum of the
briefer of the two sounds is left ambiguous, and we studied whether
listeners would infer the presence of energy in the middle band, as
moderate levels would be masked by the longer middle-band
sound.
| Listen to the basic stimulus: | Or download the audio file. | |
To measure what listeners hear in the target sound, we presented subjects with the standard stimulus followed by a comparison. The high and low frequency tabs of the comparison were fixed to be identical to those in the standard, and listeners adjusted the spectrum level of the middle band until it sounded like what they heard in the standard:
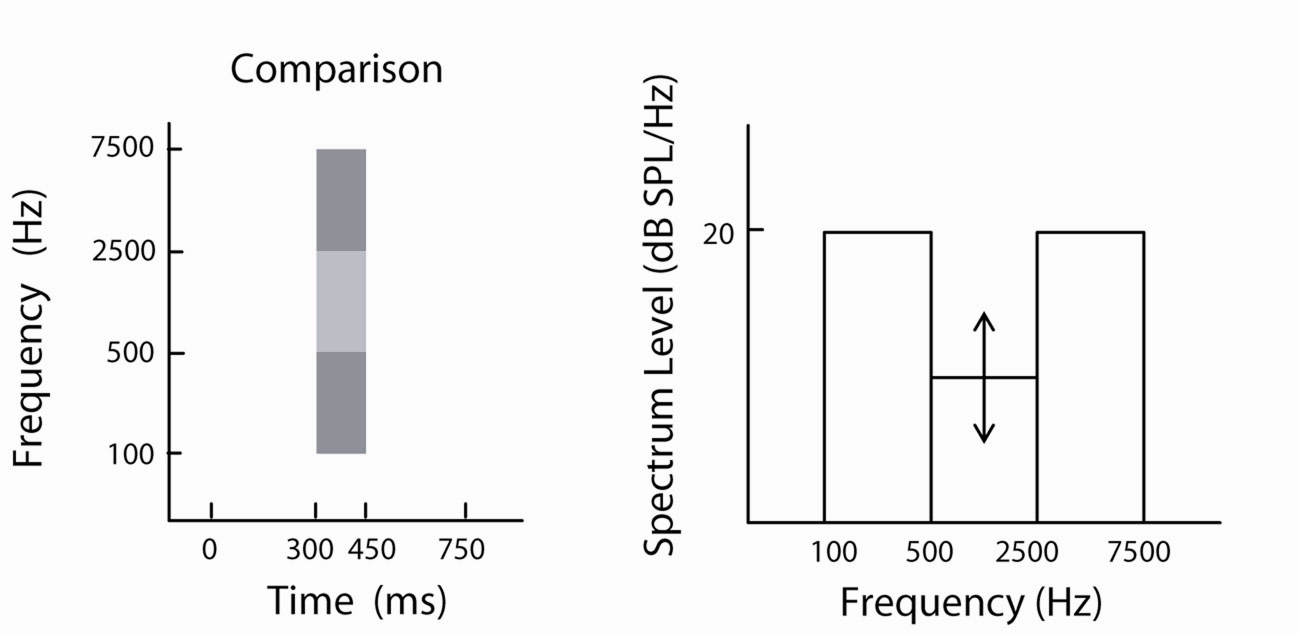
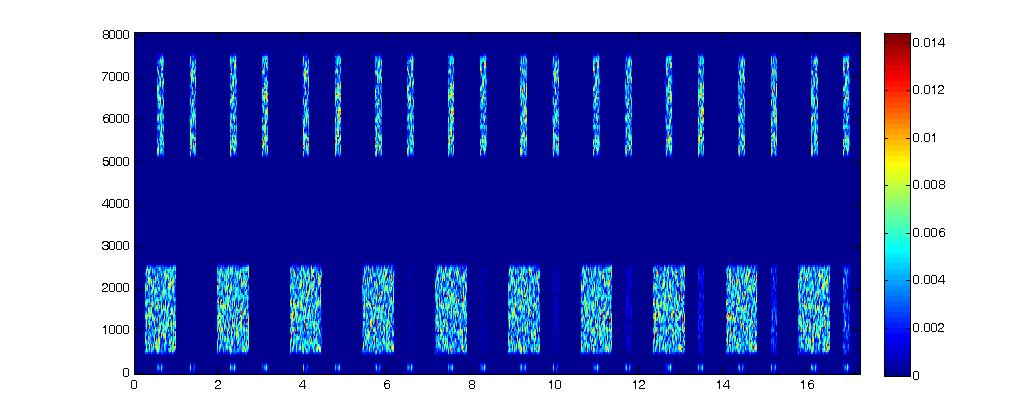
In the demo version presented here, the standard and comparison stimuli are presented iteratively, and the middle band of the comparison is gradually increased in 3.33 dB steps. Your task is to decide when the comparison sounds like a good match to the target sound of the standard. Here is a spectrogram of the stimulus:
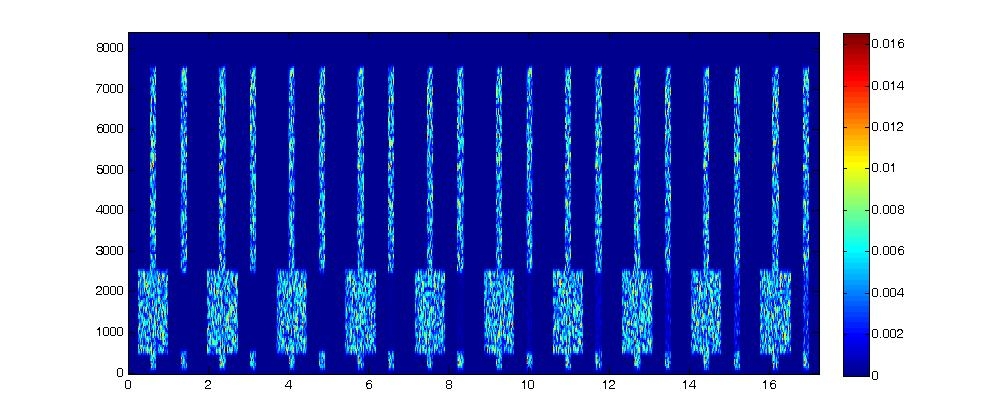
Note that the spectrogram has a linear frequency axis, which is why the proportions look funny.
People typically report that they hear a good match somewhere around the 8th iteration. During the first few iterations the comparison will sound like it is missing something, and by the last few it will sound like it has too much energy.
| Listen to the demo: | Or download the audio file. | |
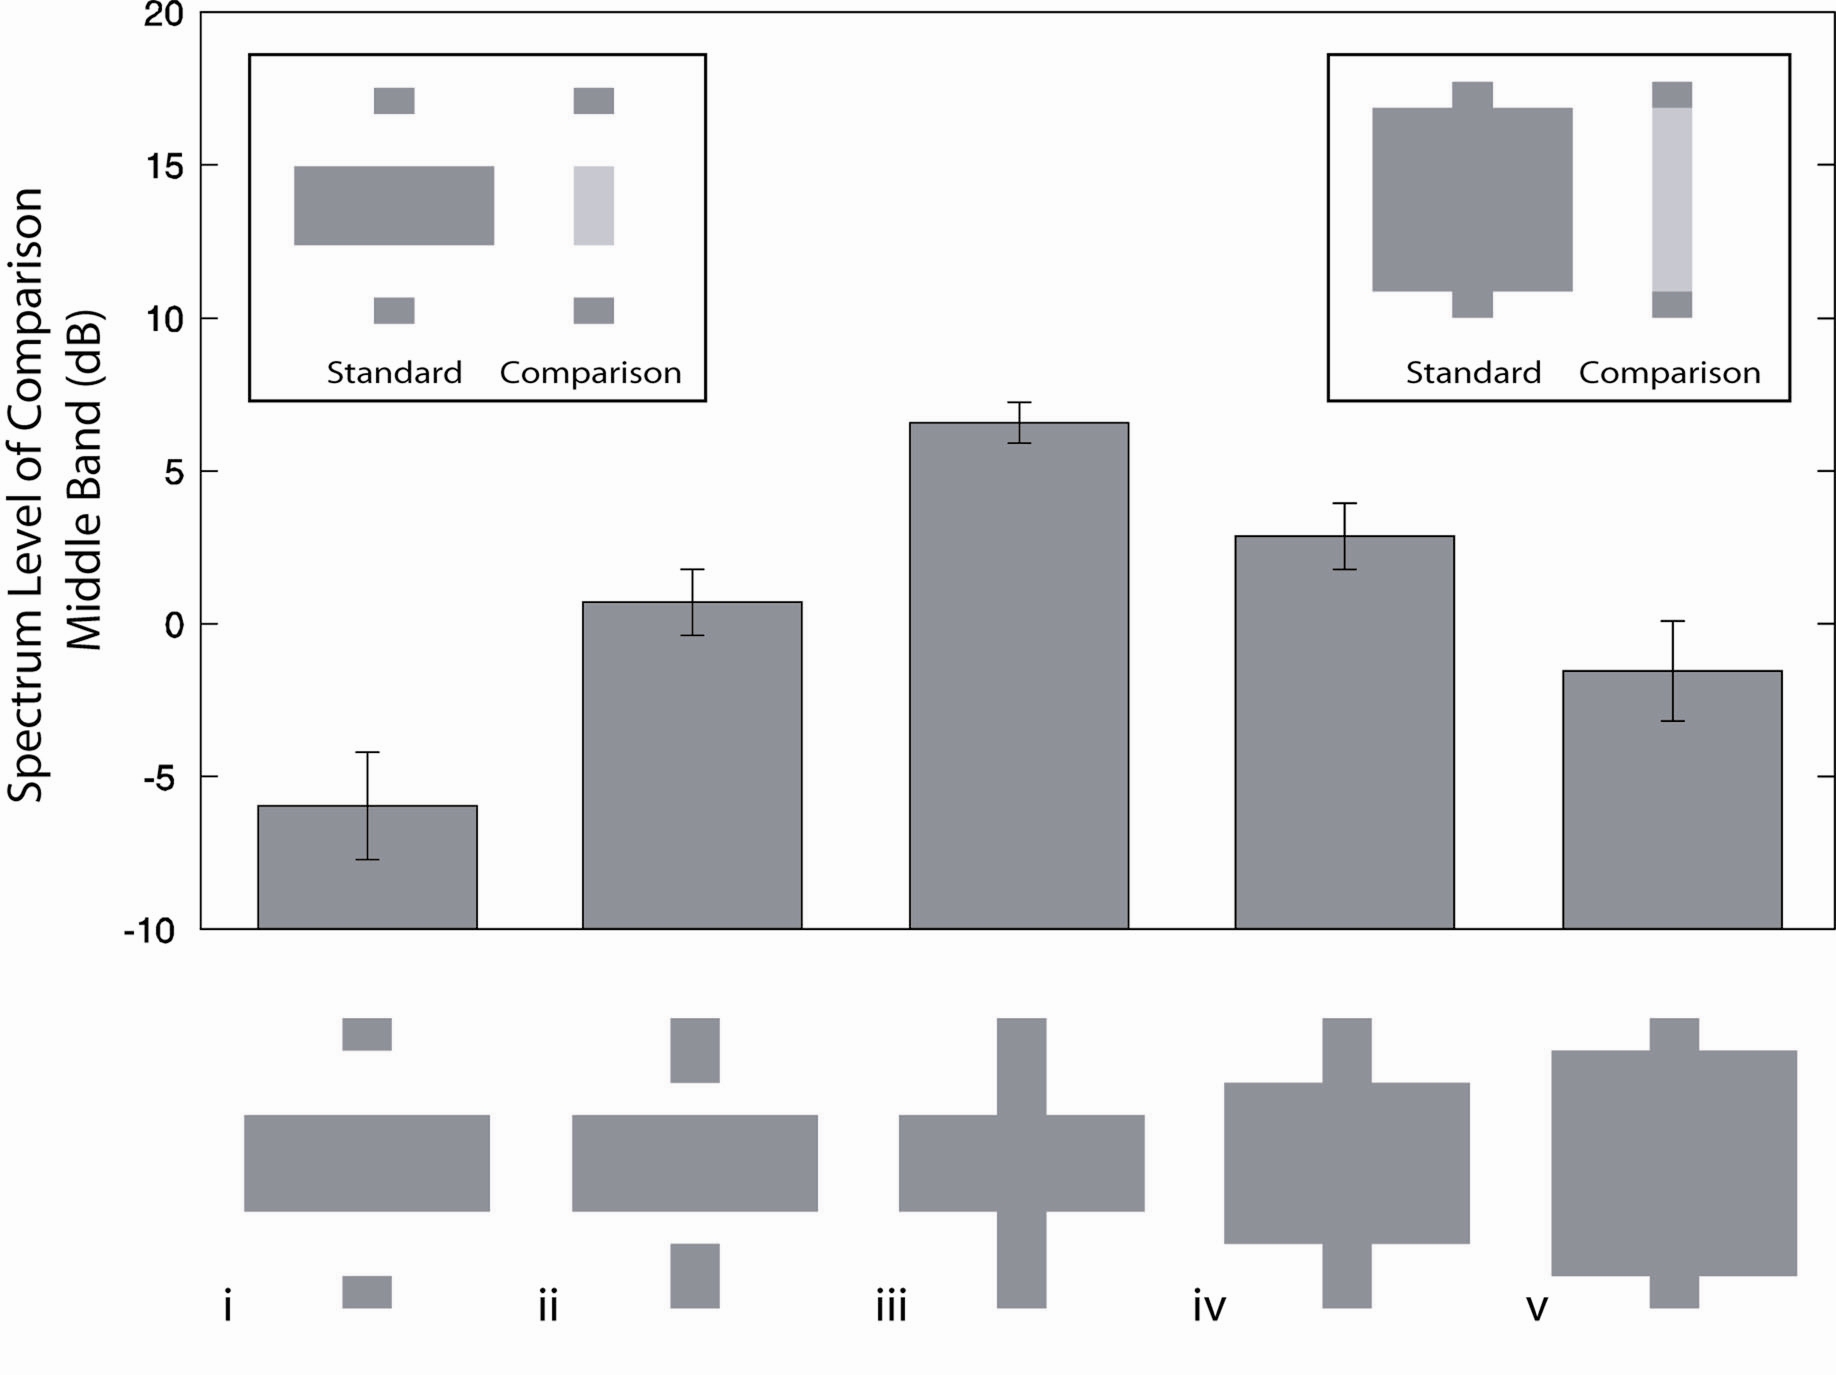
Here are the experimental results for this plus some other conditions. The y-axis plots the amount of energy subjects added to the middle band of the comparison stimuli to make it sound like what they heard in each of the various standard stimuli (shown on x-axis). Condition iii corresponds to the demo above; subjects add quite a bit of noise to the comparison to get it to sound like a match. See the paper for more details.
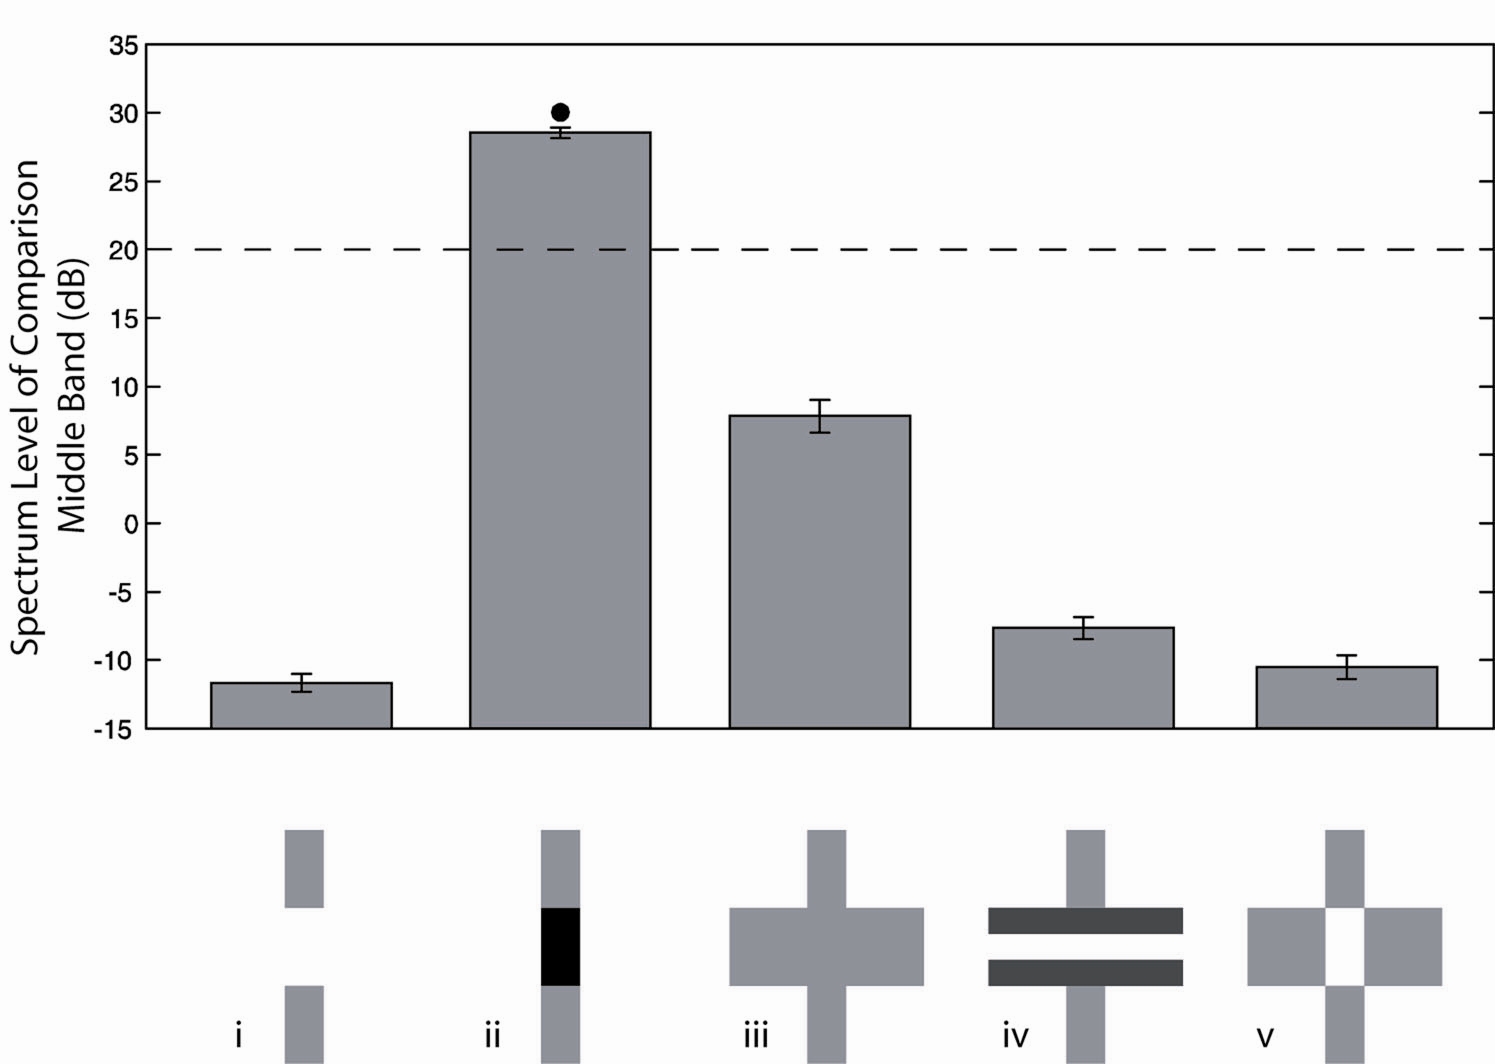
Although masker energy must be present for the effect to occur, it is not sufficient. When gaps are inserted between the tabs and masker, spectral completion is greatly reduced. Even though the middle band of the stimulus is unchanged, what subjects hear in the middle band is altered, presumably because sounds with multiple gaps in their spectra are rare, making it unlikely that the target sound contains energy in the middle band.
As before, the spectrum level of the comparison middle band is gradually increased. Unlike in the first demo, in this case the first few iterations should sound like good matches, with the comparison becoming progressively less similar to the target as energy is added.
| Listen to the demo: | Or download the audio file. | |
Here are the experimental results:
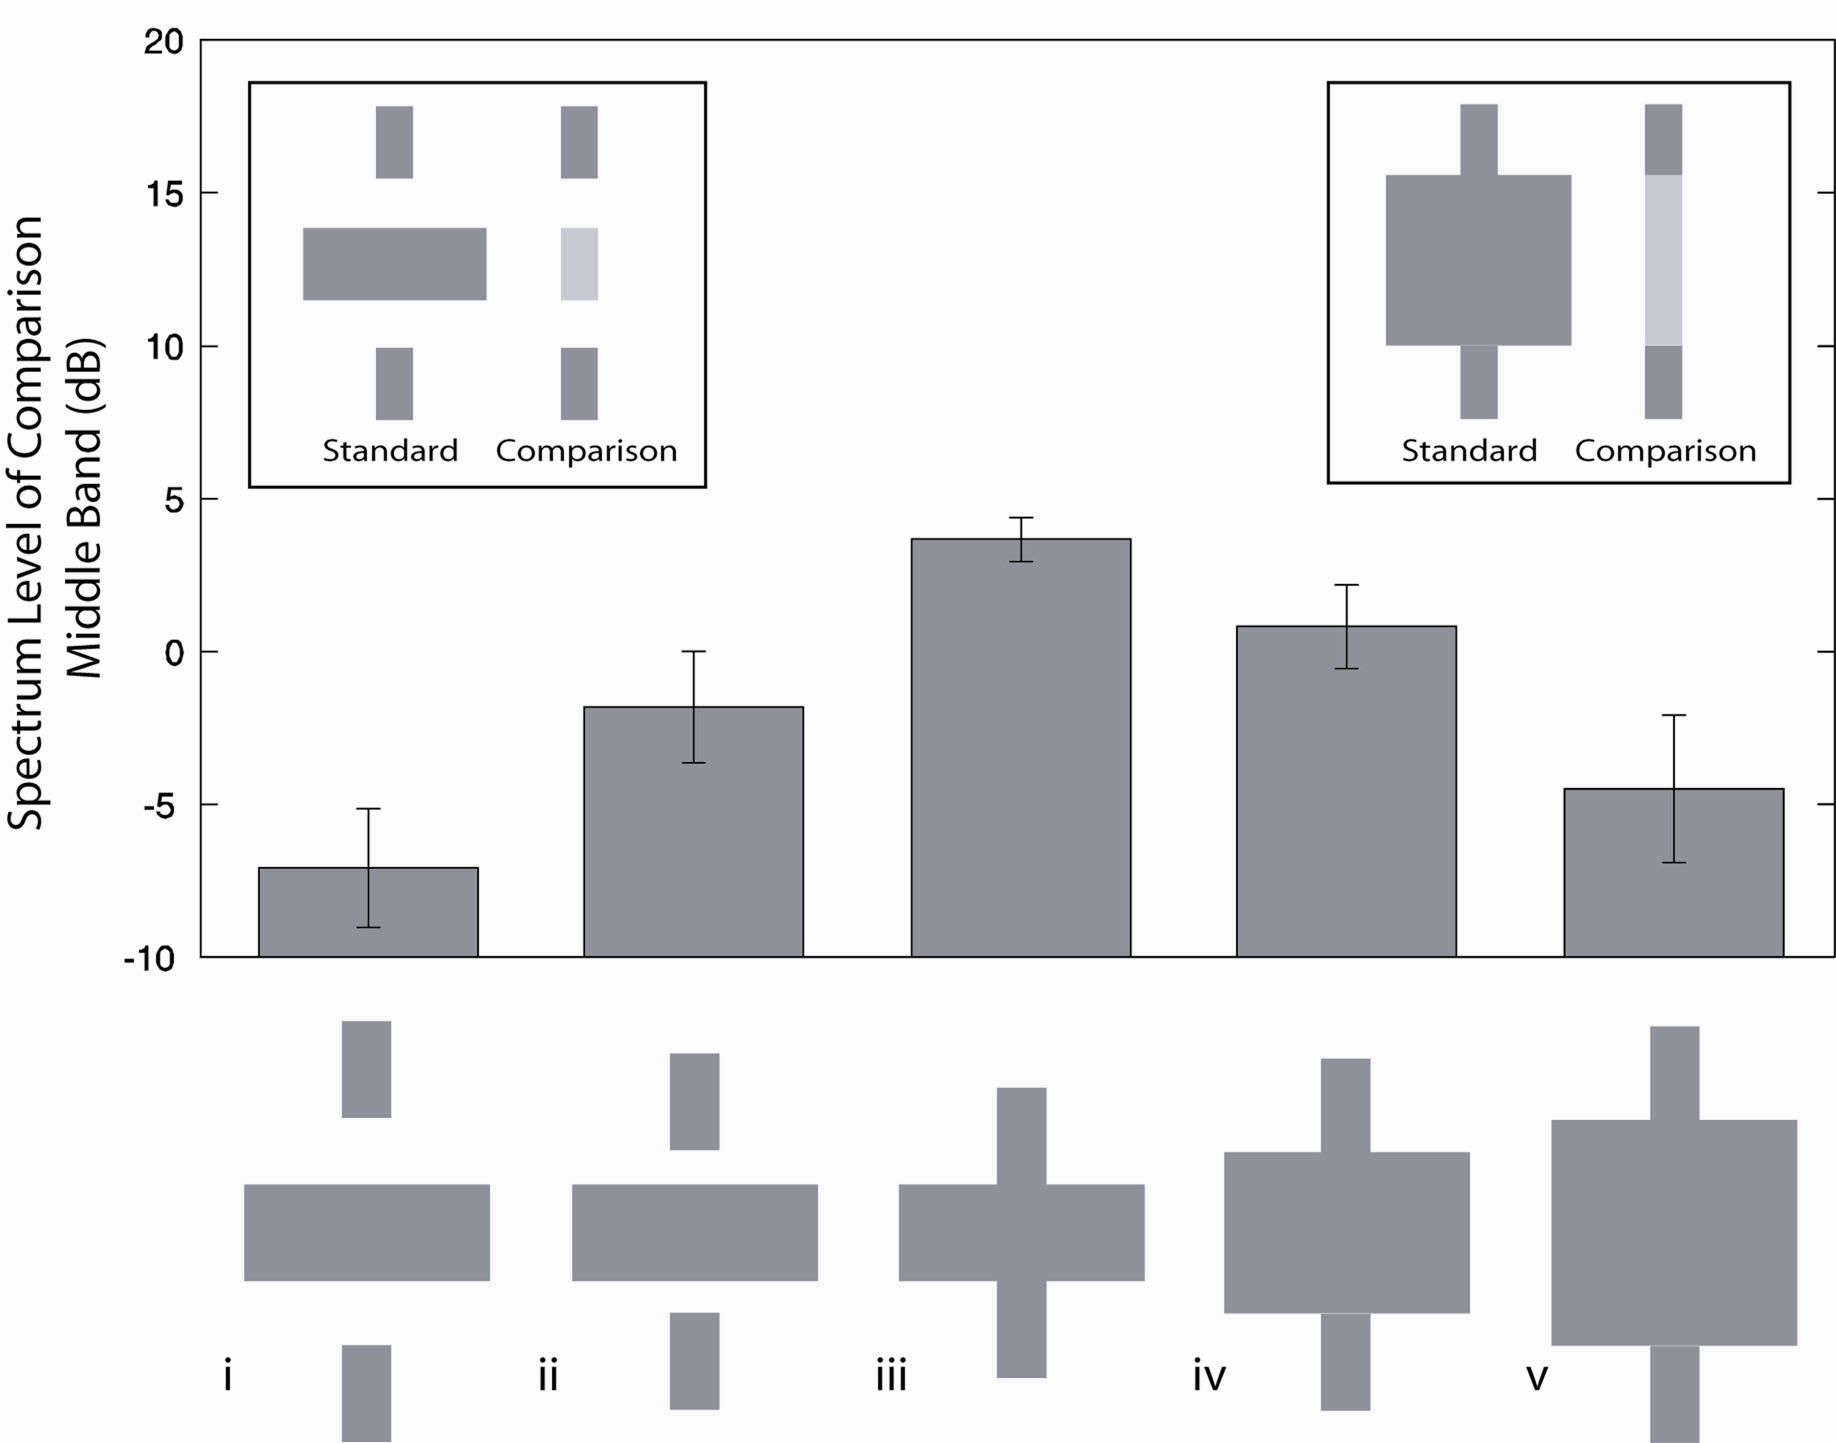
The results are similar when the tab bandwidth is held constant:
The effect also works if only the high or the low tab is present, shown here for the high tab:
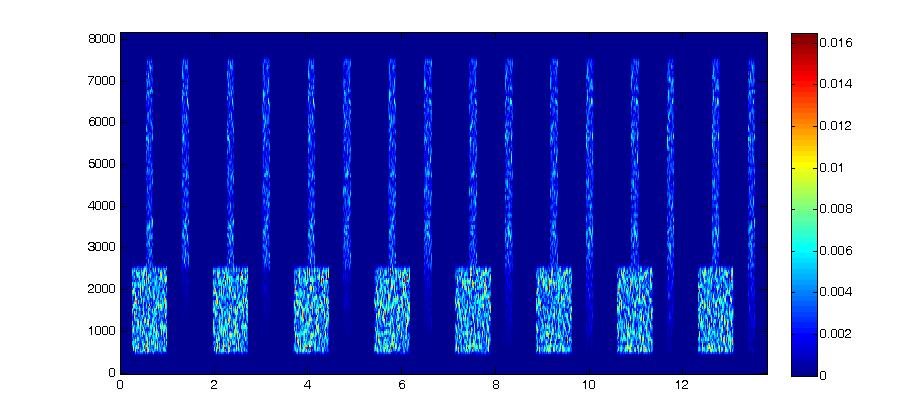
In this demo the cutoff frequency of the comparison middle band is gradually lowered, increasing the low frequency energy. The first few iterations typically sound like the comparison does not have enough low frequency energy; somewhere in the middle is generally heard as a good match.
| Listen to the basic stimulus: | Or download the audio file. | |
Experimental results:
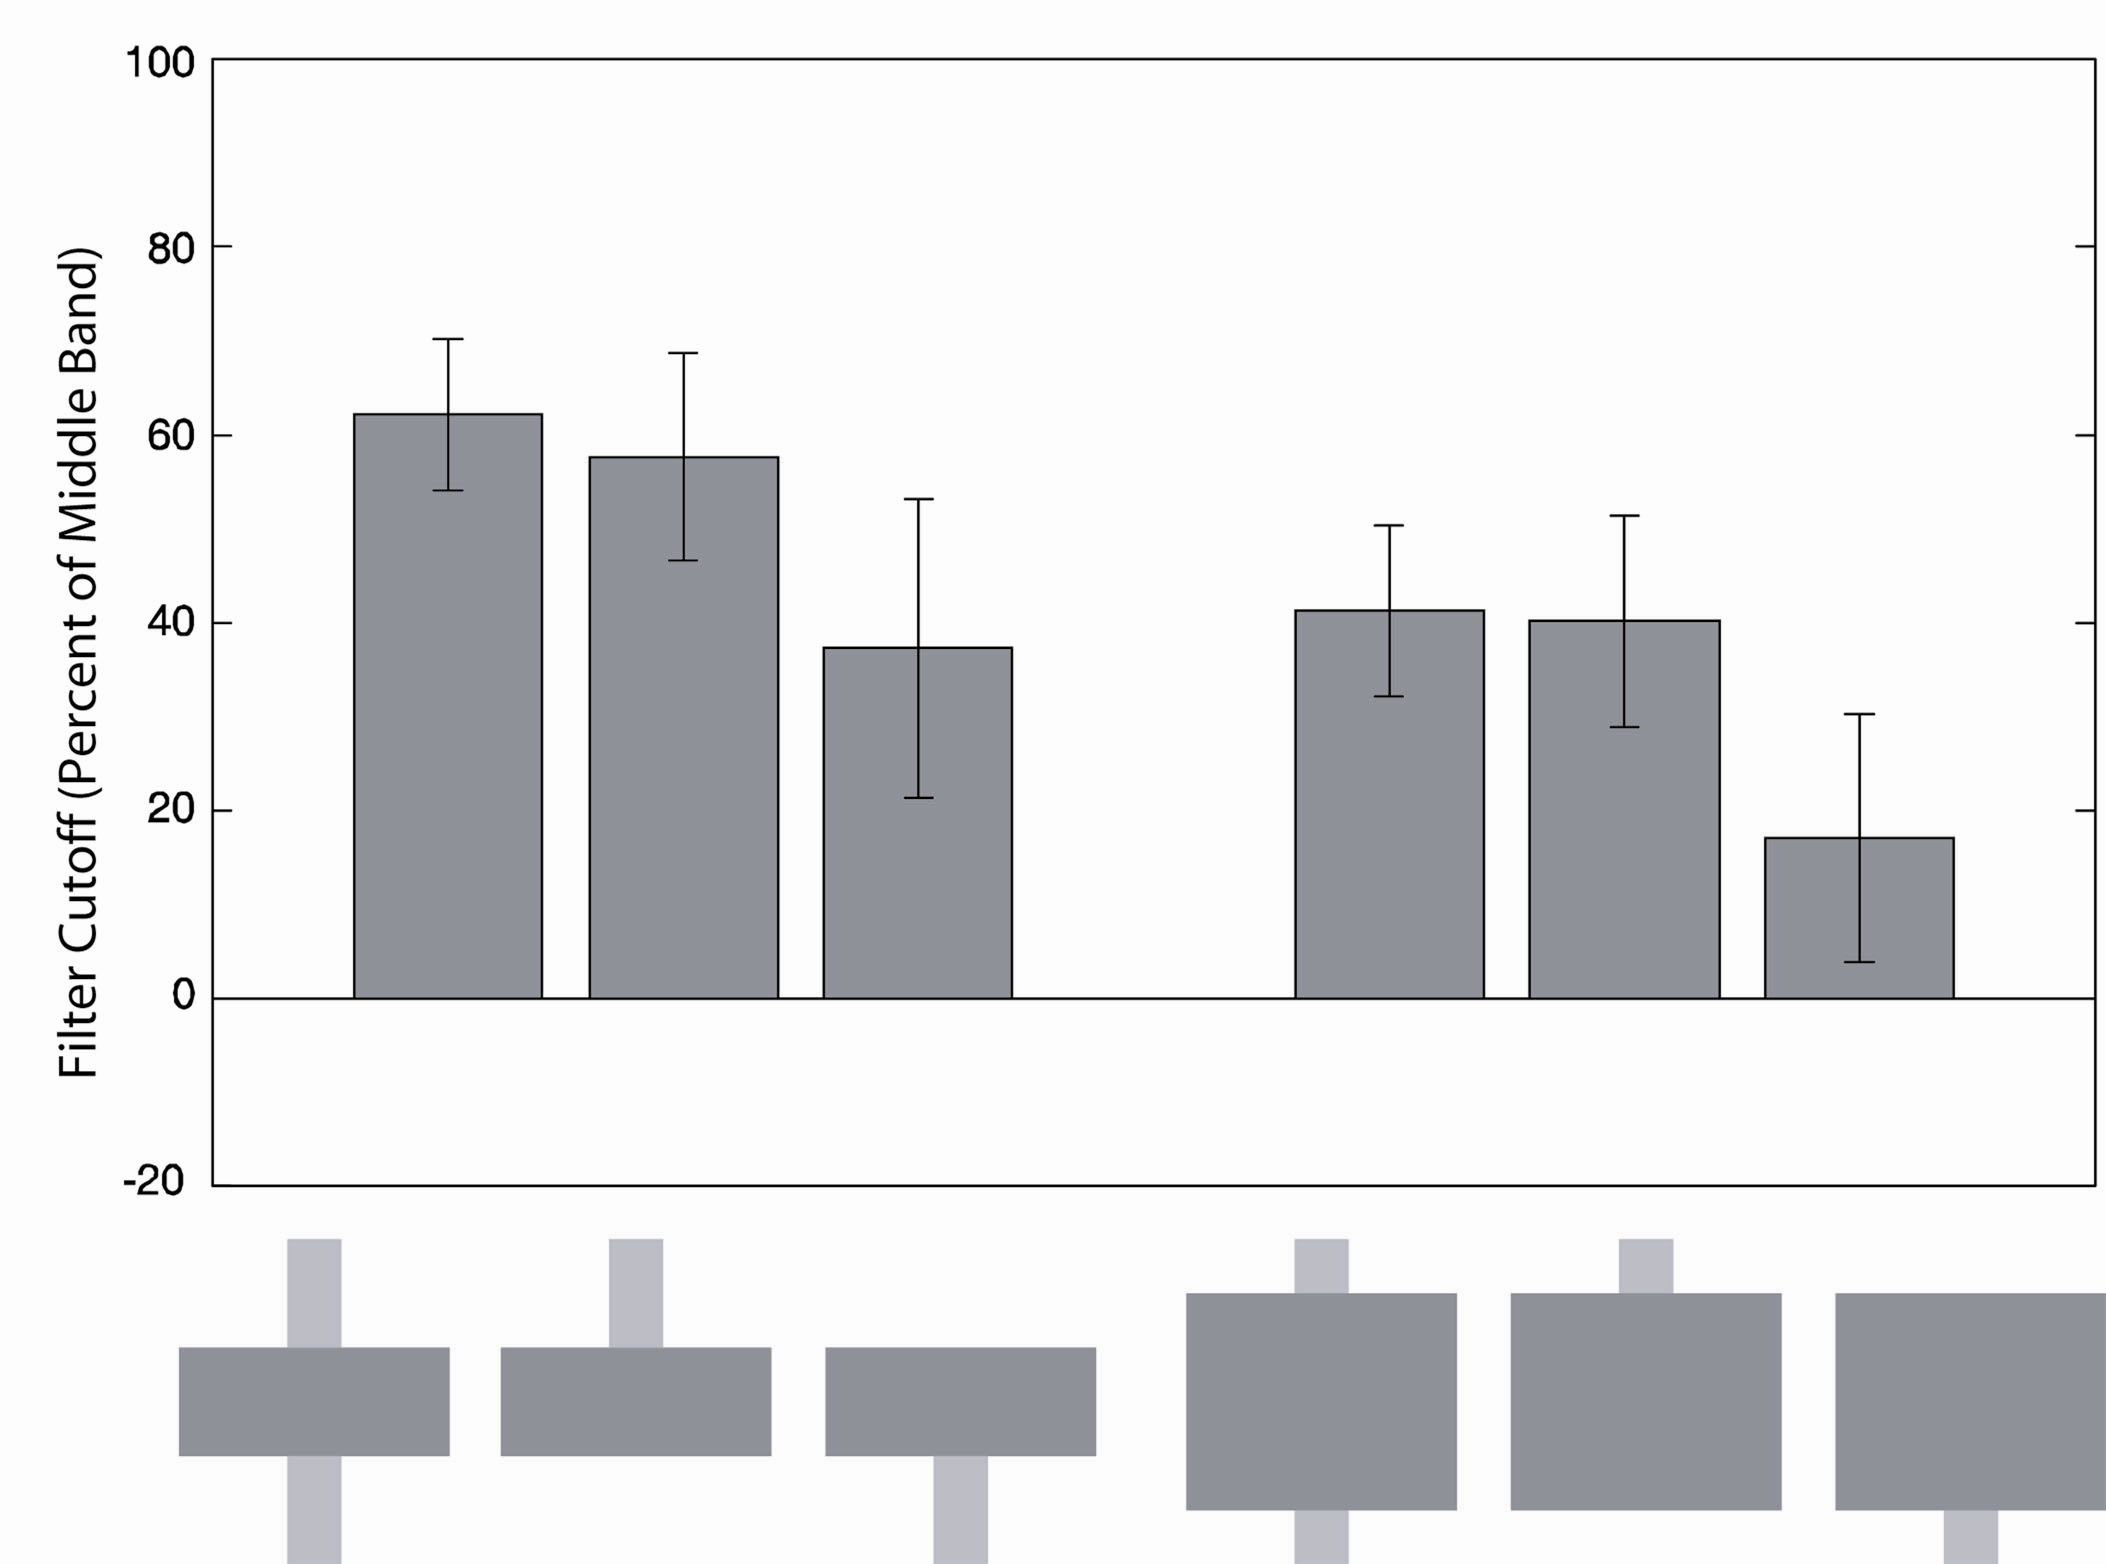
Even with only one of the tabs present, listeners hear the target as extending quite far into the middle band.
We also found that a similar effect occurs for tones:

To measure this effect, we asked listeners to add harmonics to a comparison stimulus until it matched the sound of the tone from the standard:
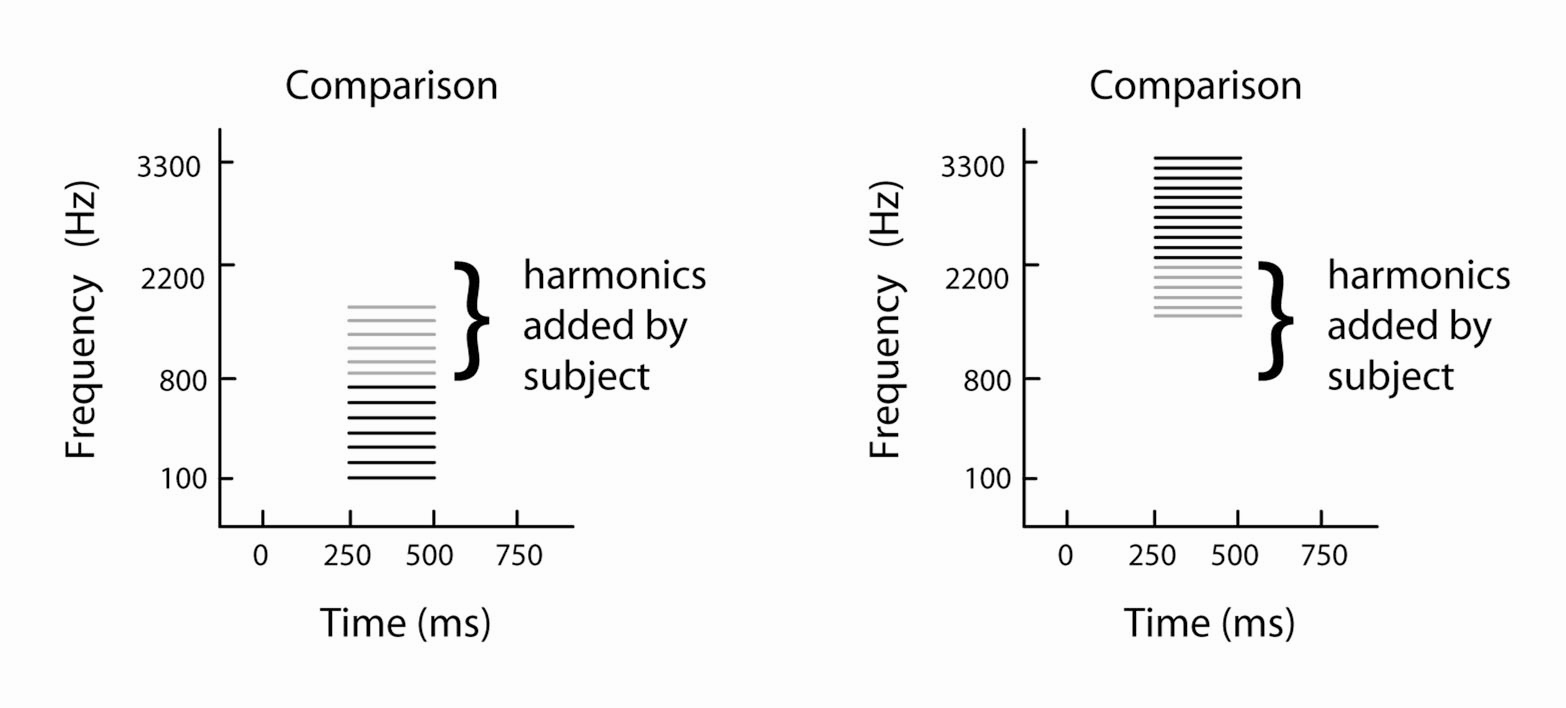
In the demo, the same tone complex is played with and without a noise masker. The tone that is played on its own (the second one in the demo below) is typically reported to sound brighter than the tone that is accompanied by the masker:
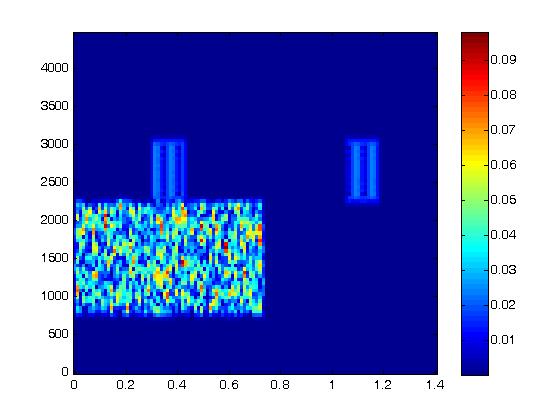
The individual harmonics of the tone are not resolved by the spectrogram.
| Listen to the demo: | Or download the audio file. | |
Note that conventional masking would predict that the masked tone ought to sound brighter (the reverse of what is observed), as the components near the masker should be reduced in their effective level.
Here are the results from the experiment:
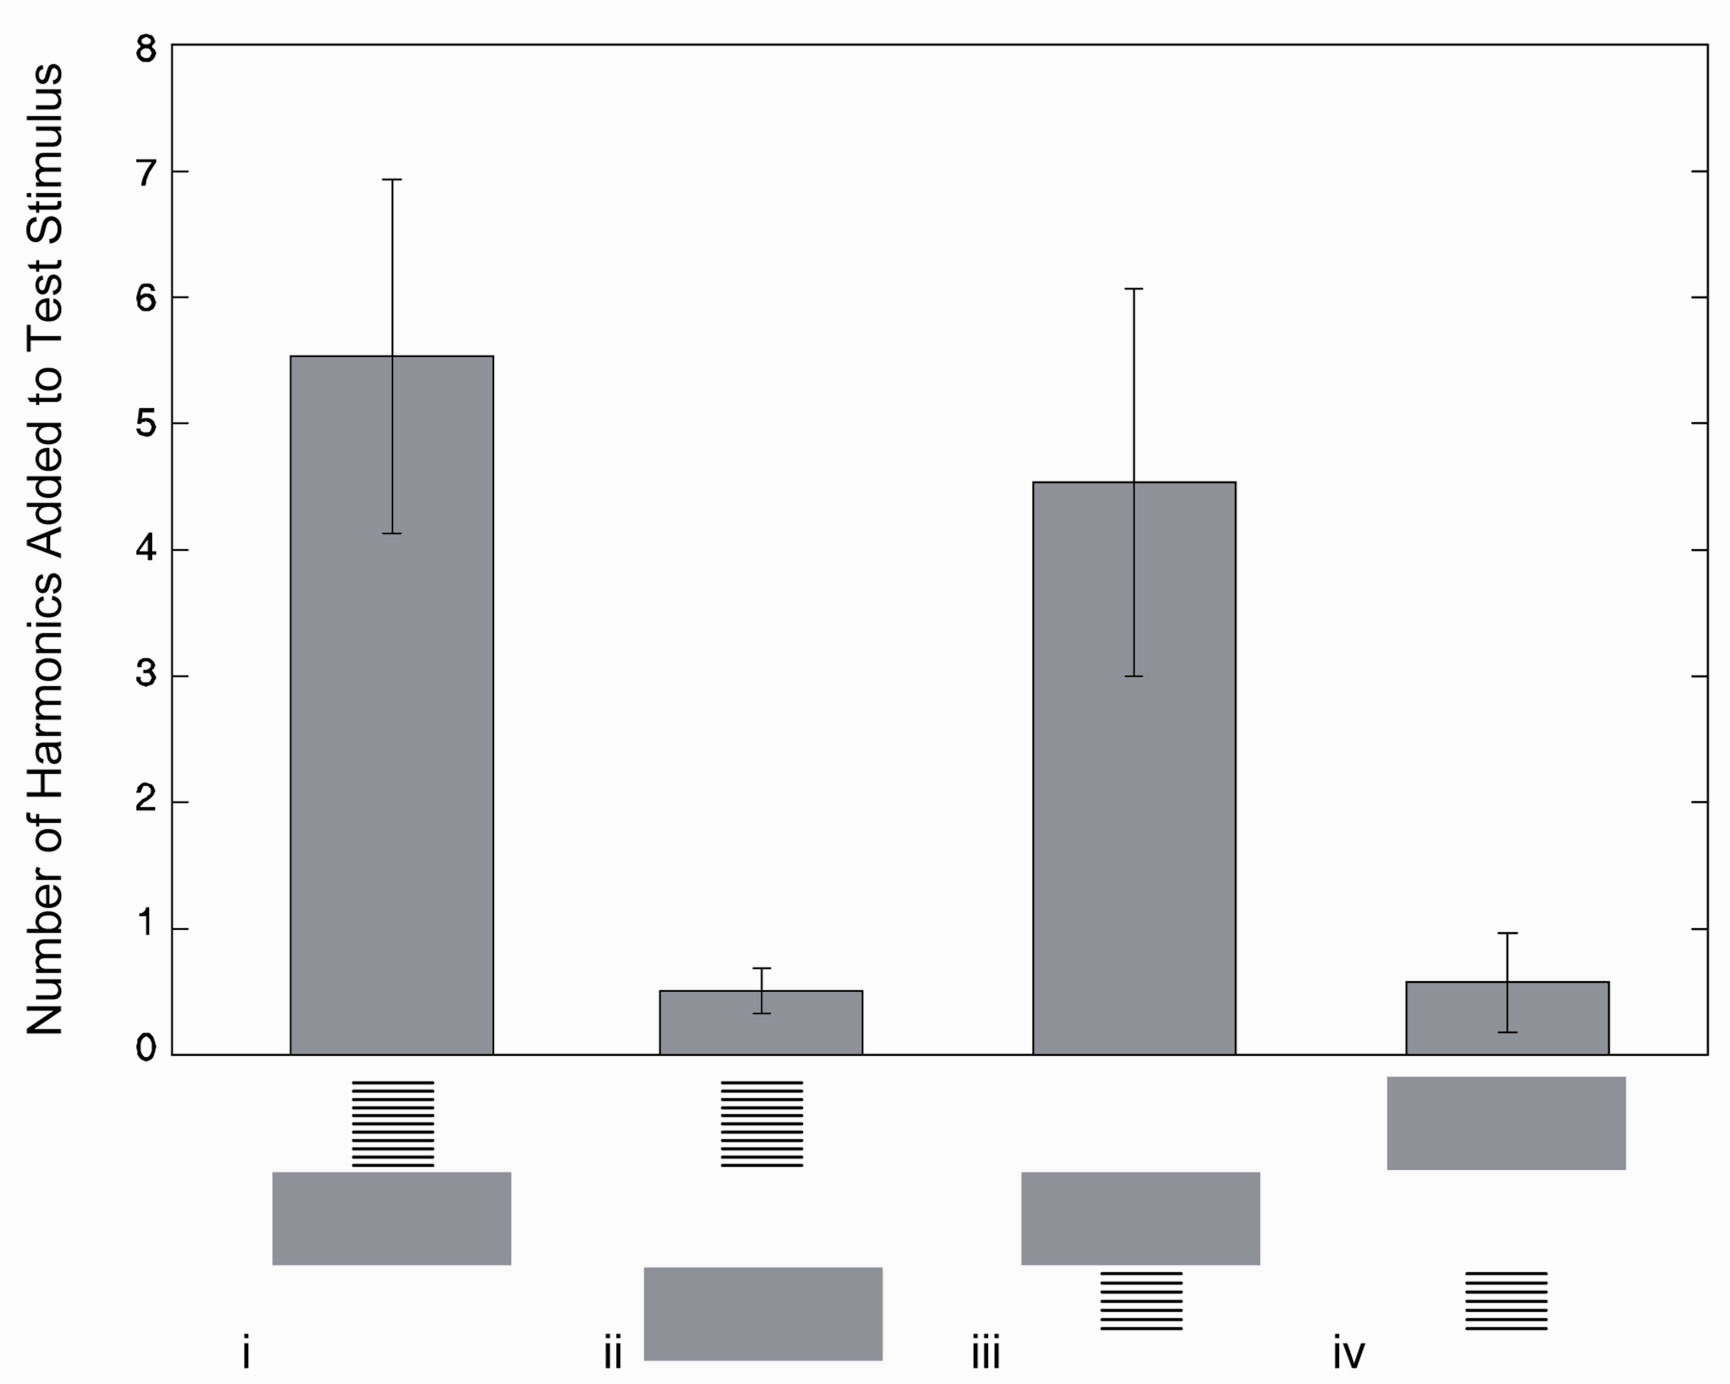
Subjects add quite a few harmonics to the comparison stimulus when the masker is adjacent to the tone, presumably because the auditory system infers that the tone might contain harmonics in the middle band that are masked by the noise.
For further details on these and other experiments, please check out the paper.
Back